The Liberals are way outperforming polls in Atlantic Canada. What if they outperform polls by the same amount across English Canada?
Out of 260 seats
LIB - 163
CON - 78
NDP - 18
GRN - 1
Shocking, right? And consider that the above is assuming that over/underperformance is the *minimum* of arithmetic and proportional change.
Have a good election night! It's likely to be easy if you're a Liberal.
Monday, October 19, 2015
Guide to Election Night
If you are a Canadian citizen over 18 and haven't voted yet, VOTE. You have until (all times local):
- 7pm in the Pacific time zone
- 7:30pm in the Mountain time zone
- 8:30pm in the Central, Atlantic and Newfoundland time zones
- 9:30pm in the Eastern time zone
Find your polling station at Elections Canada's website.
Click here for a summary of the projection.
Click here for the projected winner by riding.
Click here for a roundup and comparison of the various projections.
Click here for the complete trends since early September.
I have less time than I hoped for this, so I'll be brief. All times Eastern.
7pm: Polls close in Newfoundland. The Liberals should handily win all 3 ridings off the Avalon peninsula. They should also carry Avalon, despite the best efforts of Scott Andrews. The NDP will almost certainly win St. John's East. The race to watch is St. John's South--Mount Pearl, where both the projection and a riding poll this week suggest a very tight Liberal/NDP race.
7:30pm: Polls close in the rest of Atlantic Canada. I'm projecting 26 Liberals, 3 NDP and 3 Conservatives - the latter all in NB. Egmont (Gail Shea), Central Nova (Peter MacKay's old riding) and Halifax are all projected to narrowly go Liberal.
At this point, keep a very close eye on the popular vote. In 2011, the Conservatives outperformed polls by a similar margin across English Canada. Therefore, Atlantic Canada may be an early indication of how things are going.
- If the Liberals get above 55-56% and the Tories get below 19-20%, we could be en route to a Liberal majority.
- If the Liberals get below 52-53% and the Tories get above 22% or so, the election could turn out to be a nailbiter.
I will post a brief projection update based on the Atlantic numbers at around 9:15pm EDT.
9:30pm: Polls close in the rest of the country except BC. The big questions are:
- Will the Bloc regain official party status (12 seats)? All projections have the Bloc at 11 seats or less, but there is so much uncertainty that the odds of this happening are still quite decent.
- How well does the NDP vote hold up in Québec? The NDP is projected at 31 seats with 26.3%. But if it drops to, say, 23%, it could be looking at a disaster, and the Liberal odds of a majority would improve significantly.
- How big is the Liberal margin of victory in Ontario? The projection says 10% adjusted, 12.4% unadjusted. If that number climbs above 15%, we might have to stay up late to find out whether the Liberals win a majority. Conversely, if it drops below 8%, the Tories have a good chance of eking out a win.
- Liberal breakthrough in Calgary? Liberal/NDP breakthrough in Edmonton? The Tories have actually trended up strongly in Alberta in the past 2 weeks. The Liberals kept pace, but the NDP lost almost all of the Notley momentum, and its support fell by as much (proportionally) as in Québec since August, i.e. almost half! I think the Liberals have a good shot at 4 ridings (Calgary Centre, Confederation and Skyview, and Edmonton Mill Woods), while the NDP can hope to gain Edmonton Griesbach.
10pm: Polls close in BC. I'm projecting a very efficient vote for the Tories, and a very inefficient vote for the Liberals. Will those pan out? (They are at odds with most other models.) And what's going on in Victoria? With no public poll from that riding, it is difficult to know whether the Greens are on track to win a second seat there.
Enjoy election night, and once again, look for my post around 9:15pm EDT (follow me on Twitter if you need a reminder)!
Projection Roundup
If you are a Canadian citizen over 18 and haven't voted yet, VOTE. You have until (all times local):
- 7pm in the Pacific time zone
- 7:30pm in the Mountain time zone
- 8:30pm in the Central, Atlantic and Newfoundland time zones
- 9:30pm in the Eastern time zone
Find your polling station at Elections Canada's website.
Click here for a summary of the projection.
Click here for the projected winner by riding.
Click here for the complete trends since early September.
Below are the projections based on polling aggregates - there are links to all of these on the left. They are listed in increasing magnitude of Liberal victory (difference between Liberal and Conservative seat counts).
L-C-N-B-G-Other (Vote L, C, N, B, G)
137-120-75- 8-1-0 (36.8%, 32.5%, 21.4%, 4.6%, 4.1%) Too Close to Call
138-120-75- 1-1-0 Election Almanac*
138-117-76- 6-1-0 (36.8%, 31.8%, 22.7%, 4.2%, 4.5%) Le calcul électoral
142-119-66-10-1-0 (37.3%, 32.4%, 20.1%, 4.9%, 4.3%) Canadian Election Watch
140-115-79- 3-1-0 LISPOP*
142-116-68-11-1-0 Election Atlas
146-118-66- 7-1-0 (37.2%, 30.9%, 21.7%, 4.9%, 4.4%) ThreeHundredEight
149-105-81- 2-1-0 David Akin's Predictionator**
160-120-50- 7-1-0 (36.7%, 32.0%, 20.4%, 5.2%, 4.0%) The Signal
178-115-44- 1-0-0 (37%, 31%, 22%, 4%, 4%) CVM Election Model
177- 95-53-11-1-1 (38.0%, 30.9%, 21.3%, 5.7%, 3.4%) Teddy on Politics
*Do not appear to include late polls from yesterday.
**Significant use of information other than polls.
***It's really 137.5-117-76.5-6-1 since there's a tie in Davenport. Pierre Martin has clarified that the Liberal percentage is slightly higher in Davenport; the Liberal number above for Le calcul électoral has been updated.
Also, the Globe's election model provides similar probabilities as I gave here.
Average (may not add up due to rounding):
150-115-67- 6-1-0 (all 11 projections)
143-117-71- 6-1-0 (9 Liberal minority projections)
The first thing to notice is that two models are projecting a Liberal majority. But both of them are quite puzzling: they only have the Liberals at 37-38%! I'm almost certain that if these models are right and a Liberal majority occurs, it would be due to offsetting mistakes: bad vote projection (too low for the Liberals) and bad model (too many seats for Liberals for a given vote projection). The CVM model is also an outlier in predicting that Elizabeth May will lose her seat, while Teddy and Politics is the only one forecasting a seat for Strength and Democracy. The Signal also looks weird: it is projecting a much bigger Liberal seat count than me on similar popular vote. My sense is that 160 seats is plausible for the Liberals, but seems quite unlikely with less than 37% popular support.
The other eight more "mainstream" projections are all within very tight ranges for the major parties:
LIB 137-149
CON 105-120 (115-120 excluding David Akin)
NDP 66-81
A few observations about comparing these eight projections:
- The divergence between proportional and uniform swing models for the Liberals and Conservatives has mostly disappeared. This is because, when a party (LPC) starts very low and starts getting competitive, proportional swing concentrates the rise in support in ridings where that party has the best chances of winning. However, if that party increases further, the increase in support in marginal ridings becomes similar in the two models. The latter is what happened with the Liberals in the past week. (Theoretically, if the party increases even more and becomes very far ahead of the other parties, uniform swing would give it more seats.)
- The divergence is instead showing up for the NDP. Excluding my model, the three uniform swing models have the NDP at 75-79 seats, while the two proportional swing models having incorporated the latest data have the NDP at 66-68 seats. This is due to the NDP decrease in Québec: it is now only holding on to relatively good seats, and proportional swing makes the drop in those seats bigger than uniform swing.
- So why is my uniform swing model more like the proportional swing models for the NDP? The answer is found in the popular vote: I have the lowest NDP popular vote of all projectors. This is due to two factors:
(i) I applied a mild change to some polls from earlier this week in order to reflect the change in voting intention since then; this cost the NDP a few tenths; and
(ii) the pro-CPC turnout adjustment.
- I also have a relatively high CPC popular vote, obviously due to the turnout adjustment. Too Close to Call also has a turnout adjustment, but it is smaller than mine; on the other hand, that model did not apply the change described in (i) above. These two differences appear to cancel out. The Signal also has a similar CPC vote, presumably because it missed some late polls.
- I have a relatively high LPC popular vote despite the turnout adjustment because of the change described in (i) above. Note that without the turnout adjustment, my projection of 150 seats (on 38.3%) for the Liberals is higher than all non-outliers.
- Finally, the Bloc seat count is incredibly hard to pin down - projections range from 1 to 11... Honestly, for the Bloc, it felt like throwing a dart with a blindfold since no pollster has come out with a regional breakdown of Québec since the NDP's plunge there.
- 7pm in the Pacific time zone
- 7:30pm in the Mountain time zone
- 8:30pm in the Central, Atlantic and Newfoundland time zones
- 9:30pm in the Eastern time zone
Find your polling station at Elections Canada's website.
Click here for a summary of the projection.
Click here for the projected winner by riding.
Click here for the complete trends since early September.
Below are the projections based on polling aggregates - there are links to all of these on the left. They are listed in increasing magnitude of Liberal victory (difference between Liberal and Conservative seat counts).
L-C-N-B-G-Other (Vote L, C, N, B, G)
137-120-75- 8-1-0 (36.8%, 32.5%, 21.4%, 4.6%, 4.1%) Too Close to Call
138-120-75- 1-1-0 Election Almanac*
138-117-76- 6-1-0 (36.8%, 31.8%, 22.7%, 4.2%, 4.5%) Le calcul électoral
142-119-66-10-1-0 (37.3%, 32.4%, 20.1%, 4.9%, 4.3%) Canadian Election Watch
140-115-79- 3-1-0 LISPOP*
142-116-68-11-1-0 Election Atlas
146-118-66- 7-1-0 (37.2%, 30.9%, 21.7%, 4.9%, 4.4%) ThreeHundredEight
149-105-81- 2-1-0 David Akin's Predictionator**
160-120-50- 7-1-0 (36.7%, 32.0%, 20.4%, 5.2%, 4.0%) The Signal
178-115-44- 1-0-0 (37%, 31%, 22%, 4%, 4%) CVM Election Model
177- 95-53-11-1-1 (38.0%, 30.9%, 21.3%, 5.7%, 3.4%) Teddy on Politics
*Do not appear to include late polls from yesterday.
**Significant use of information other than polls.
Also, the Globe's election model provides similar probabilities as I gave here.
Average (may not add up due to rounding):
150-115-67- 6-1-0 (all 11 projections)
143-117-71- 6-1-0 (9 Liberal minority projections)
The first thing to notice is that two models are projecting a Liberal majority. But both of them are quite puzzling: they only have the Liberals at 37-38%! I'm almost certain that if these models are right and a Liberal majority occurs, it would be due to offsetting mistakes: bad vote projection (too low for the Liberals) and bad model (too many seats for Liberals for a given vote projection). The CVM model is also an outlier in predicting that Elizabeth May will lose her seat, while Teddy and Politics is the only one forecasting a seat for Strength and Democracy. The Signal also looks weird: it is projecting a much bigger Liberal seat count than me on similar popular vote. My sense is that 160 seats is plausible for the Liberals, but seems quite unlikely with less than 37% popular support.
The other eight more "mainstream" projections are all within very tight ranges for the major parties:
LIB 137-149
CON 105-120 (115-120 excluding David Akin)
NDP 66-81
A few observations about comparing these eight projections:
- The divergence between proportional and uniform swing models for the Liberals and Conservatives has mostly disappeared. This is because, when a party (LPC) starts very low and starts getting competitive, proportional swing concentrates the rise in support in ridings where that party has the best chances of winning. However, if that party increases further, the increase in support in marginal ridings becomes similar in the two models. The latter is what happened with the Liberals in the past week. (Theoretically, if the party increases even more and becomes very far ahead of the other parties, uniform swing would give it more seats.)
- The divergence is instead showing up for the NDP. Excluding my model, the three uniform swing models have the NDP at 75-79 seats, while the two proportional swing models having incorporated the latest data have the NDP at 66-68 seats. This is due to the NDP decrease in Québec: it is now only holding on to relatively good seats, and proportional swing makes the drop in those seats bigger than uniform swing.
- So why is my uniform swing model more like the proportional swing models for the NDP? The answer is found in the popular vote: I have the lowest NDP popular vote of all projectors. This is due to two factors:
(i) I applied a mild change to some polls from earlier this week in order to reflect the change in voting intention since then; this cost the NDP a few tenths; and
(ii) the pro-CPC turnout adjustment.
- I also have a relatively high CPC popular vote, obviously due to the turnout adjustment. Too Close to Call also has a turnout adjustment, but it is smaller than mine; on the other hand, that model did not apply the change described in (i) above. These two differences appear to cancel out. The Signal also has a similar CPC vote, presumably because it missed some late polls.
- I have a relatively high LPC popular vote despite the turnout adjustment because of the change described in (i) above. Note that without the turnout adjustment, my projection of 150 seats (on 38.3%) for the Liberals is higher than all non-outliers.
- Finally, the Bloc seat count is incredibly hard to pin down - projections range from 1 to 11... Honestly, for the Bloc, it felt like throwing a dart with a blindfold since no pollster has come out with a regional breakdown of Québec since the NDP's plunge there.
Projected Winner by Riding
Click here for a summary of the projection. Click here for the complete trends since early September.
I'm a little too tired to do the maps (I don't have an automatic system set up), so I'll simply list the winner in each of the 166 ridings decided by under 12%. (The rest is presumably obvious, though feel free to ask; I do list ridings decided by more than 12% if there is only one such riding for that party in the area.)
I expect around 60 ridings to be incorrectly called, for an accuracy of 80-85%. Below 80% would be disappointing, and below 75% would be a bad night. Above 85% would be good, and above 90% is very unlikely unless the aggregate projection is nearly on the dot. Here is how other projectors and I did in 2011 - success rates hovered around 80%.
*89 ridings decided by 4-12% (10-33% chance of being wrong - potentially more if three-way race)
**77 ridings decided by less than 4% (more than 33% chance of being wrong)
Note that the 172 other ridings still have an up to 10% chance of being wrong - so there will very probably be some mistakes among them.
(The model actually gives 62 ridings decided by less than 4% and 96 ridings decided by 4-12%, but I upgraded the uncertainty in some cases in the list below, mostly due to riding polls showing closer-than-expected races.)
BC (Vancouver Island)
NDP (4): Cowichan--Malahat--Langford**, Nanaimo--Ladysmith*, Victoria*, Esquimalt--Saanich--Sooke
CON (2): Courtenay--Alberni**, North Island--Powell River**
GRN (1): Saanich--Gulf Islands
BC (Lower Mainland)
CON (11): Burnaby North--Seymour**, Coquitlam--Port Coquitlam**, South Surrey--White Rock**, Steveston--Richmond East**, Richmond Centre*, 6 others
LIB (10): Delta**, Fleetwood--Port Kells**, Surrey Centre*, Vancouver Granville*, Vancouver South*, West Vancouver--Sunshine Coast--Sea to Sky Country*, 4 others
NDP (5): Burnaby South*, Port Moody--Coquitlam*, Vancouver Kingsway*, 2 others
BC (Interior and North)
CON (7): Cariboo--Prince George**, Kootenay--Columbia**, Central Okanagan--Similkameen--Nicola*, Kamloops--Thompson--Cariboo*, North Okanagan--Shuswap*, 2 others
NDP (2): South Okanagan--West Kootenay**, Skeena--Bulkley Valley
Alberta
CON (32): Calgary Centre**, Calgary Skyview**, Edmonton Griesbach**, Edmonton Mill Woods**, Edmonton Centre*, 27 others
LIB (1): Calgary Confederation**
NDP (1): Edmonton Strathcona
Saskatchewan
CON (10): Saskatoon--Grasswood**, Saskatoon--University**, Regina--Qu'Appelle*, 7 others
NDP (3): Desnethé--Missinippi--Churchill River**, Regina--Lewvan**, Saskatoon West**
LIB (1): Regina--Wascana
Manitoba
CON (7): Charleswood--St. James--Assiniboia--Headingley*, 6 others
LIB (4)
NDP (3): Churchill--Keewatinook Aski**, Elmwood--Transcona**, Winnipeg Centre*
Northern Ontario
NDP (5): Algoma--Manitoulin--Kapuskasing*, Sudbury*, Thunder Bay--Superior North*, Timmins--James Bay*, Nickel Belt
LIB (3): Thunder Bay--Rainy River**, Sault Ste. Marie**, Nipissing--Timiskaming
CON (3): Kenora**, Huron--Bruce*, Parry Sound--Muskoka
City of Toronto
LIB (23): York Centre**, Beaches--East York*, Eglinton--Lawrence*, Parkdale--High Park*, Spadina--Fort York*, University--Rosedale*, 17 others
NDP (2): Davenport**, Toronto--Danforth
Toronto CMA outside of City of Toronto (this is a bit smaller than the 905)
LIB (23): King--Vaughan**, Newmarket--Aurora**, Oakville North--Burlington**, Brampton Centre*, Brampton North*, Oakville*, Aurora--Oak Ridges--Richmond Hill*, Vaughan--Woodbridge*, 15 others
CON (5): Milton**, Thornhill*, 3 others
Rest of Ontario
CON (28): Bruce--Grey--Owen Sound**, Kitchener South--Hespeler**, Niagara Falls**, Northumberland--Peterborough South**, Simcoe--Grey**, Simcoe North**, Barrie--Springwater--Oro-Medonte*, Cambridge*, Carleton*, Chatham-Kent--Leamington*, Durham*, Essex*, Flamborough--Glanbrook*, Hastings--Lennox and Addington*, Lambton--Kent--Middlesex*, Lanark--Frontenac--Kingston*, Oshawa*, Perth--Wellington*, Renfrew--Nipissing--Pembroke*, Sarnia--Lambton*, 8 others
LIB (22): Bay of Quinte**, Brantford--Brant**, Burlington**, Kitchener--Conestoga**, Niagara Centre**, St. Catharines**, Haldimand--Norfolk*, Kanata-Carleton*, Nepean*, 13 others
NDP (7): Hamilton East--Stoney Creek**, Hamilton Mountain**, Ottawa Centre**, London--Fanshawe*, Windsor--Tecumseh*, 2 others
Island of Montréal
LIB (13): LaSalle--Émard--Verdun*, 12 others
NDP (4): Hochelaga**, La Pointe-de-l'Île**, Outremont**, Rosemont--La Petite-Patrie*
BQ (1): Laurier--Sainte-Marie**
Montréal CMA off the Island of Montréal
NDP (12): Longueuil--Charles-LeMoyne**, Marc-Aurèle-Fortin**, La Prairie*, Rivière-des-Mille-Îles*, Mirabel*, Châteauguay--Lacolle*, Thérèse-De Blainville*, Longueuil--Saint-Hubert*, Montcalm*, Terrebonne*, Repentigny*, Rivière-du-Nord
LIB (6): Montarville**, Vaudreuil--Soulanges**, Laval--Les Îles*, Vimy*, 2 others
BQ (2): Beloeil--Chambly**, Pierre-Boucher--Les Patriotes--Verchères**
Quebec City CMA
CON (6): Beauport--Limoilou**, Charlesbourg--Haute-Saint-Charles*, Portneuf--Jacques-Cartier*, 3 others
LIB (2): Louis-Hébert**, Québec**
BQ (1): Beauport--Côte-de-Beaupré--Île d'Orléans--Charlevoix**
Rest of Québec
NDP (15): Abitibi--Baie-James--Nunavik--Eeyou**, Berthier--Maskinongé**, Joliette**, Laurentides--Labelle**, Manicouagan**, Abitibi--Témiscamingue*, Chicoutimi--Le Fjord*, Drummond*, Hull--Aylmer*, Jonquière*, Saint-Hyacinthe--Bagot*, Saint-Jean*, Shefford*, Trois-Rivières*, Gatineau
BQ (6): Avignon--La Mitis--Matane--Matapédia**, Compton--Stanstead**, Rimouski-Neigette--Témiscouata--Les Basques**, Salaberry--Suroît**, Bécancour--Nicolet--Saurel*, Sherbrooke*
LIB (5): Argenteuil--La Petite-Nation**, Gaspésie--Les Îles-de-la-Madeleine**, Saint-Maurice--Champlain**, Brome--Missisquoi*, Pontiac*
CON (5)
New Brunswick
LIB (6): Saint John--Rothesay**, Miramichi--Grand Lake*, 4 others
CON (3): Fundy Royal*, New Brunswick Southwest*, Tobique--Mactaquac*
NDP (1): Acadie--Bathurst
Nova Scotia
LIB (10): Central Nova*, Halifax*, 8 others
NDP (1): Sackville--Preston--Chezzetcook*
Prince Edward Island
LIB (4): Egmont*, 3 others
Newfoundland and Labrador
LIB (6): St. John's South--Mount Pearl*, 5 others
NDP (1): St. John's East
Territories
LIB (3): Northwest Territories**, Nunavut**, Yukon
2015 Federal Election, Final Projection: LIBERAL MINORITY
Canadian Election Watch's final projection for the 2015 federal election is as follows:
LIB - 142 (37.3%)
CON - 119 (32.4%)
NDP - 66 (20.1%)
BQ - 10 (4.9%)
GRN - 1 (4.3%)
In order to take into account the movement observed in the past few days toward the Liberals, conservative modifications were made to some polls taken earlier in the week based on the evolution of the Nanos and EKOS tracking polls. Moreover, the turnout adjustment used throughout the campaign was reduced by around one fifth outside of Québec in order to take into account movement from the CPC to the LPC among seniors. Finally, a riding-by-riding examination of the projection resulted in some seats being moved (mostly in Québec); the net effect of this was no more than 2 seats for any party.
(Update: I changed some probabilities below since a larger than usual number of ridings are tight.)
This projection implies a Liberal seat plurality short of a majority with probability around70-75% 65%. The probability of a Conservative seat plurality is around 20-25% 25%. Either of these scenarios would likely result in a Liberal minority government. There is a roughly 5% 10% chance of a Liberal majority government. The probability of a Conservative majority and of an NDP seat plurality are negligible. (Please note that these probabilities are not derived from simulations, as would be ideal. They are instead estimated using the method outlined here.)
If you believe that polls accurately sample the electorate, you should instead refer to the projection below, which does not include a turnout adjustment:
LIB - 150 (38.3%)
CON - 111 (30.9%)
NDP - 65 (20.6%)
BQ - 11 (4.9%)
GRN - 1 (4.6%)
Such numbers imply a Liberal seat plurality short of a majority with probability around75% 65-70%. A Conservative seat plurality and a Liberal majority have a 10-15% roughly 15% and 15-20% chance of occurring, respectively.
Therefore, depending on whether one believes in the turnout adjustment, the probability of a Liberal win is around either75-80% or 85-90% 75% or 85%. Thus, although the Liberals are clear favourites, there is a significant chance of a slim Conservative plurality. Similarly, a Liberal majority cannot be ruled out.
The main (i.e. adjusted) projection by region is as follows:
Atlantic Canada
LIB - 26 (53.5%)
CON - 3 (21.1%)
NDP - 3 (20.2%)
GRN - 0 (4.2%)
Québec
NDP - 31 (26.3%)
LIB - 26 (30.1%)
CON - 11 (20.5%)
BQ - 10 (19.4%)
GRN - 0 (2.6%)
Ontario
LIB - 71 (44.3%)
CON - 36 (34.3%)
NDP - 14 (16.7%)
GRN - 0 (3.7%)
Manitoba/Saskatchewan
CON - 17 (41.7%)
LIB - 5 (32.6%)
NDP - 6 (20.7%)
GRN - 0 (4.1%)
Alberta
CON - 32 (56.3%)
LIB - 1 (24.4%)
NDP - 1 (15.0%)
GRN - 0 (3.3%)
British Columbia
CON - 20 (32.1%)
NDP - 11 (25.1%)
LIB - 10 (32.8%)
GRN - 1 (8.9%)
Territories
LIB - 3
As you can see, the Liberals are projected to win the popular vote in Québec, but due to the concentration of their vote, they are projected to win fewer seats than the NDP. It should be noted, however, that Québec is replete with three-way (and some four-way) races, so the seat projection in Québec is less reliable than usual.
The Liberals are also projected to be in a tight contest with the Conservatives for winning the BC popular vote. However, they are favoured in only half as many seats as the Tories.
Today's posting schedule is roughly as follows:
- Overnight: Projected winner in each riding
- Day: Guide to election night
- Day (if time allows): Roundup and comparison of projections around the web
- Around 9:00-9:15pm ET: Updated projection based on Atlantic results
LIB - 142 (37.3%)
CON - 119 (32.4%)
NDP - 66 (20.1%)
BQ - 10 (4.9%)
GRN - 1 (4.3%)
In order to take into account the movement observed in the past few days toward the Liberals, conservative modifications were made to some polls taken earlier in the week based on the evolution of the Nanos and EKOS tracking polls. Moreover, the turnout adjustment used throughout the campaign was reduced by around one fifth outside of Québec in order to take into account movement from the CPC to the LPC among seniors. Finally, a riding-by-riding examination of the projection resulted in some seats being moved (mostly in Québec); the net effect of this was no more than 2 seats for any party.
(Update: I changed some probabilities below since a larger than usual number of ridings are tight.)
This projection implies a Liberal seat plurality short of a majority with probability around
If you believe that polls accurately sample the electorate, you should instead refer to the projection below, which does not include a turnout adjustment:
LIB - 150 (38.3%)
CON - 111 (30.9%)
NDP - 65 (20.6%)
BQ - 11 (4.9%)
GRN - 1 (4.6%)
Such numbers imply a Liberal seat plurality short of a majority with probability around
Therefore, depending on whether one believes in the turnout adjustment, the probability of a Liberal win is around either
The main (i.e. adjusted) projection by region is as follows:
Atlantic Canada
LIB - 26 (53.5%)
CON - 3 (21.1%)
NDP - 3 (20.2%)
GRN - 0 (4.2%)
Québec
NDP - 31 (26.3%)
LIB - 26 (30.1%)
CON - 11 (20.5%)
BQ - 10 (19.4%)
GRN - 0 (2.6%)
Ontario
LIB - 71 (44.3%)
CON - 36 (34.3%)
NDP - 14 (16.7%)
GRN - 0 (3.7%)
Manitoba/Saskatchewan
CON - 17 (41.7%)
LIB - 5 (32.6%)
NDP - 6 (20.7%)
GRN - 0 (4.1%)
Alberta
CON - 32 (56.3%)
LIB - 1 (24.4%)
NDP - 1 (15.0%)
GRN - 0 (3.3%)
British Columbia
CON - 20 (32.1%)
NDP - 11 (25.1%)
LIB - 10 (32.8%)
GRN - 1 (8.9%)
Territories
LIB - 3
As you can see, the Liberals are projected to win the popular vote in Québec, but due to the concentration of their vote, they are projected to win fewer seats than the NDP. It should be noted, however, that Québec is replete with three-way (and some four-way) races, so the seat projection in Québec is less reliable than usual.
The Liberals are also projected to be in a tight contest with the Conservatives for winning the BC popular vote. However, they are favoured in only half as many seats as the Tories.
Today's posting schedule is roughly as follows:
- Overnight: Projected winner in each riding
- Day: Guide to election night
- Day (if time allows): Roundup and comparison of projections around the web
- Around 9:00-9:15pm ET: Updated projection based on Atlantic results
Sunday, October 18, 2015
Final Projection Trends
Before I figure out how to deal with the issues raised in the previous post for the final projection, I present the last update of projection trends. I'm doing this before the final projection since trends are most informative when computed with a consistent methodology.


The vote shares tell a similar story, though the Tories have lost only 2 points in the past 2 weeks. The Liberal surge, especially in Ontario, hurt the Conservatives more than the drop in their own support (i.e. if it were instead the NDP that had gained support, the Tories would not have lost as many seats). More remarkable is the fact that the NDP has lost over 1/3 of its support since Labour Day.
Finally, I should also mention that the Greens have lost roughly 1 point in the past 2 weeks, probably as progressive voters switched in order to "make their vote count." This is why Elizabeth May pleaded for people to vote their conscience.
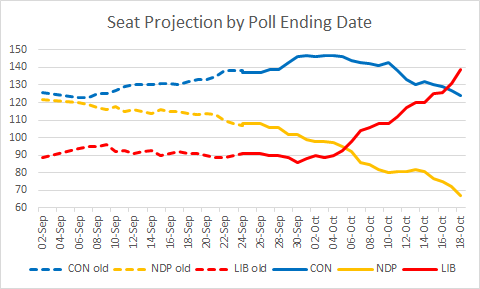
For those of you that are new, the dotted lines indicate that those projections were made without taking into account riding polls and sub-regional breakdowns.
As you can see, in the past 2 weeks, the Liberals have gained seats at a fairly consistent rate of 3-4 seats per day. The Tories have been losing 1-2 seats per day, also fairly consistently. The NDP, however, has had two periods of steep drops with an interlude in between: for a while, it appeared as though the NDP stopped the bleeding at around 80 seats, but the down trend then resumed with a vengeance.

Finally, I should also mention that the Greens have lost roughly 1 point in the past 2 weeks, probably as progressive voters switched in order to "make their vote count." This is why Elizabeth May pleaded for people to vote their conscience.
Ipsos, EKOS, Forum, Nanos, Insights West: Liberal Lead Grows
And we have come to the last polls of the campaign.
Ipsos' last poll for Global shows stable numbers nationally and in ON compared to last week. The Liberals remain in front in Québec, and have crossed the 30% threshold, like in Nanos, Léger and Mainstreet. The Liberals are also at 40% in BC, which looks like an outlier.
EKOS' last poll showed some movement (well short of statistical significance, but still): the Liberal lead widened from 1.7% to 3.9%. None of the regional changes is that exciting (the Tory 15-point lead in BC shrank to a still-large 10-point lead). However, the Liberals erased the gap with the Tories among seniors. Note that Ipsos, Mainstreet and Forum (below) show the same thing. Only Angus Reid, on which my turnout adjustment is partly based, has the Tories still doing well among seniors.
Forum's last poll shows a 10-point lead for the Liberals, and led Forum to project a Liberal majority! The most shocking numbers are in Québec, where Forum has the Liberals well in front at 36%, while the three other main parties are all in the 19-22% range.
Nanos' last poll has a bigger sample, so Nanos provided the national numbers for each day. The Liberal national lead was 8.6-8.7% on both Saturday and Sunday. There were no big regional variations from the last Nanos poll.
Finally, Insights West provided polls of Alberta and BC that are consistent with the polling average.
The following is NOT the final projection. Two things still need to be done:
- I will go through the country riding-by-riding.
- I will chew on the excellent Liberal numbers from today and the fact that the senior gap has been erased. I will probably end up putting even more weight on recent numbers and reducing the turnout adjustment.
Therefore, I expect the final projection to be somewhat more favourable to the Liberals than the projection below:
LIB - 139, +9 (36.5%, +1.1%)
CON - 124, -3 (32.7%, -0.3%)
NDP - 67, -5 (20.7%, -0.9%)
BQ - 7, -1 (4.8%)
GRN - 1 (4.3%, +0.1%)
These numbers imply a roughly 65-70% chance of a Liberal win, including a 3-5% chance of a Liberal majority.
The unadjusted projection is:
LIB - 147 (37.6%)
CON - 113 (31.1%)
NDP - 68 (21.3%)
BQ - 9 (4.7%)
GRN - 1 (4.5%)
These unadjusted numbers imply a roughly 85% percent chance of a Liberal win, including a 10% chance of a Liberal majority.
So, still to come overnight:
- Final projection
- List of projected winner in each riding (hopefully on a map, but I'm tired...)
Unfortunately, I do not expect to have time to provide a guide to strategic voting.
Tomorrow:
- Roundup of projections around the web
- Things to watch on election night
- Around 9:00-9:15pm EDT (just before polls close in most of the country): Updated projection based on Atlantic results
EKOS: Liberals Grow ON Lead; Tories Jump in BC
Update: Throughout the day, I will update the projection on the left as new polls come out, and I will tweet the updates. However, I will not write another post until this evening.
Today's (first) EKOS update is out, and while it shows fairly stable numbers nationally, there are some interesting regional movements:
- In Québec, the Tories drop all the way from second to fourth, swapping ranks with the Bloc; the NDP, Liberals and Bloc are all within a 2-point range. In the projection, fully 16 Québec ridings are being won with less than 30% of the vote!
- In Ontario, the Liberal lead widens from 8.3% to 12%.
- In BC, the Tories jump to a 16-point lead over the NDP and the Liberals.
None of these variations are statistically significant - EKOS urges special caution on the BC numbers.
The Bloc jump in QC and Conservative jump in BC cost the NDP (Liberals marginally take another NB seat from the Tories):
LIB - 130, +1 (35.4%, +0.1%)
CON - 127 (33.0%, -0.1%)
NDP - 72, -2 (21.6%, -0.1%)
BQ - 8, +1 (4.8%)
GRN - 1 (4.2%, +0.1%)
The Liberal unadjusted lead widens to over 5 points for the first time, but the Tories benefit from the BC jump:
LIB - 139 (36.5%)
CON - 115 (31.4%)
NDP - 72 (22.2%)
BQ - 11 (4.8%)
GRN - 1 (4.5%)
EKOS will provide another update (and its own projection) with today's data. So we still have at least 3 more polls coming: EKOS, Ipsos and Nanos. They even rhyme! (Though if past elections are any indication, Forum may join the party too.)
Nanos: Stability; PROJECTION LEAD FLIPS BACK TO LIBERALS
Today's Nanos poll is essentially the same as yesterday's. There has been small drops in the Liberal leads in QC and ON, but nothing of note as the Liberal number changed by less than 1% in both cases. The NDP lost 3.2 points in BC and is well back of the Liberals and the Conservatives, similar to what Mainstreet showed yesterday.
The Liberals gain and retake the lead in the projection mostly due to the reduction of the weight on old polls:
LIB - 129, +3 (35.3%, +0.2%)
CON - 127, -2 (33.1%, -0.1%)
NDP - 74, -1 (21.7%, -0.2%)
BQ - 7 (4.8%, +0.1%)
GRN - 1 (4.1%)
With two more updates today, there are two more chances for the projection to flip... The unadjusted projection is:
LIB - 140 (36.4%)
CON - 113 (31.5%)
NDP - 74 (22.3%)
BQ - 10 (4.8%)
GRN - 1 (4.3%)
Saturday, October 17, 2015
EKOS: Virtual Tie; TORIES REGAIN PROJECTION LEAD
Today's EKOS update tells a different story from this morning's polls: the Liberals have a razor-thin 0.4-point lead. Québec is a complete mess: the NDP is in first place with just 25.6% of the support - that's a drop of 4.8 points from yesterday; the Liberals are also down, to just 21.9%, while the Tories and especially the Bloc shot up. Ontario, however, remains stable, with the Liberals slightly widening their lead to 8.3 points. Finally, the Tories have taken a 5-point lead in BC, with the Liberals falling all the way from first place to a 12-point deficit! (Remember that all 3 polls this morning had the Liberals on top in BC, but Angus Reid's likely voter model shows similar results as EKOS.)
Liberals lose seats in QC and BC in the projection update, where the Tories retake the lead:
CON - 129, +1 (33.2%, +0.1%)
LIB - 126, -3 (35.1%, -0.2%)
NDP - 75, +1 (21.9%, +0.1%)
BQ - 7, +1 (4.7%, +0.1%)
GRN - 1 (4.1%, -0.2%)
The unadjusted projection is:
LIB - 139 (36.2%)
CON - 113 (31.5%)
NDP - 75 (22.5%)
BQ - 10 (4.7%)
GRN - 1 (4.4%)
There will be several updates tomorrow:
- Morning: Nanos 10/15-17
- Afternoon: EKOS 10/15-17
- Night: Final projection with Nanos 10/16-18
- Late night: Analysis (and hopefully maps) of the final projection, guide to strategic voting
There will also be an Ipsos poll (and possibly a Forum poll) to be added when available.
Obviously, with the current projection so tight, tomorrow's numbers will determine the call. But in a sense, it doesn't matter: barring a huge surprise, it's going to be around 50/50 one way or the other. Moreover, even if the Conservatives eke out a small win, the next government is still likely to be Liberal. Nevertheless, with the race so tight and with Québec so unpredictable, the next 55 hours are going to be extremely exciting!
Léger, Mainstreet, Nanos: NDP Falls in Québec; LIBERALS TAKE LEAD IN PROJECTION
Just when you thought things have settled in Québec, all three polls out this morning have the Liberals in the lead there: Léger and Mainstreet, both with a large sample of about 1,000 in QC, have the Liberals in first place at 31-32%, followed by the NDP at just 25%; Nanos also has the Liberals increasing their still marginal lead, 30.9% to 28.5%. What's more, according to Léger, it's a three-way race among francophones: 27% apiece for the Liberals and the Bloc, 26% for the NDP. This is all terrible news for the NDP: is its campaign, which has been steadily losing steam, crashing and burning in Québec in the final few days? Conversely, the Liberals get one more path to victory, and the Bloc's chance of retrieving official party status just shot up.
Nationally, all three polls have the Liberals ahead by 5-8 points, and all three show an Ontario Liberal lead of 11-12.3 points. Suddenly, Ontario looks settled, and Québec is back in the spotlight. All three polls also show the following order in BC: Liberal, Conservative, NDP. That's another nail in the coffin for the NDP.
As you can imagine, the NDP suffered a heavy drop in the projection:
LIB - 129, +6 (35.3%, +0.6%)
CON - 128 (33.1%)
NDP - 74, -8 (21.8%, -0.6%)
BQ - 6, +2 (4.6%)
GRN - 1 (4.3%, +0.1%)
The Liberals have now taken the lead in the projection, albeit by a hair. It's really 50/50 at this point, if you believe the turnout adjustment. For a while, it looked like the Liberals would need to win the popular vote by 3-4 points in order to tie the Tories in the seat count. However, because the recent surge in Liberal support was concentrated in Ontario, the Liberal vote became less inefficient.
Without the turnout adjustment, the Liberals are well ahead:
LIB - 141 (36.4%)
CON - 112 (31.5%)
NDP - 76 (22.4%)
BQ - 8 (4.6%)
GRN - 1 (4.5%)
That's a 15-20% chance of a Tory minority, a 75-80% chance of a Liberal minority, and a 5% chance of a Liberal majority.
It's unclear whether we'll get final updates from any pollster other than Nanos and EKOS. (Update: In addition to Nanos and EKOS, Ipsos will be out with a final poll.) Hopefully Abacus, Forum (and maybe even Environics or CROP), Innovative and Ipsos will also give us a better idea of what's happening in Québec. (Update: Abacus and Innovative will not provide another batch of voting intention numbers) It makes a HUGE difference whether the NDP is at 30% or 25% there.
Nationally, all three polls have the Liberals ahead by 5-8 points, and all three show an Ontario Liberal lead of 11-12.3 points. Suddenly, Ontario looks settled, and Québec is back in the spotlight. All three polls also show the following order in BC: Liberal, Conservative, NDP. That's another nail in the coffin for the NDP.
As you can imagine, the NDP suffered a heavy drop in the projection:
LIB - 129, +6 (35.3%, +0.6%)
CON - 128 (33.1%)
NDP - 74, -8 (21.8%, -0.6%)
BQ - 6, +2 (4.6%)
GRN - 1 (4.3%, +0.1%)
The Liberals have now taken the lead in the projection, albeit by a hair. It's really 50/50 at this point, if you believe the turnout adjustment. For a while, it looked like the Liberals would need to win the popular vote by 3-4 points in order to tie the Tories in the seat count. However, because the recent surge in Liberal support was concentrated in Ontario, the Liberal vote became less inefficient.
Without the turnout adjustment, the Liberals are well ahead:
LIB - 141 (36.4%)
CON - 112 (31.5%)
NDP - 76 (22.4%)
BQ - 8 (4.6%)
GRN - 1 (4.5%)
That's a 15-20% chance of a Tory minority, a 75-80% chance of a Liberal minority, and a 5% chance of a Liberal majority.
Friday, October 16, 2015
Angus Reid: Liberals Take Lead; EKOS: Stability
Angus Reid has released its final poll of the campaign, and it has the Liberals up 4, the NDP down 3, and the Tories down 2. This produces a 4-point national lead for the Liberals. Angus Reid's likely voter model brings it down to a 1-point national lead. However, in Ontario, Angus Reid's likely voter screen does not change the numbers, and the Liberals have a 10-point lead either way, up from a tie in last week's poll. This is good news for the Liberals since Ontario is where their support level matters most. On the other hand, in BC, Angus Reid puts the Liberals 3-4 points (7-9 points with the likely voter screen) behind the other parties, unlike most other recent polls that have the Liberals at least tied for the lead. Interestingly, Angus Reid's likely voter model does not penalize the NDP even though it has lower support among seniors.
Today's EKOS shows mostly stability. The NDP has come down a little in QC (to 30.4%, consistent with what other polls show), and the Liberal lead in ON shrinks again, to 7.1%. Neither of these shifts are statistically significant, though given that the Liberals need to win ON by around 8% to win the election, we're really in an area where every point there can make the difference.
The updated projection moves toward the Liberals due mostly to the reduction of the weight on last week's Angus Reid:
CON - 128, -3 (33.1%, -0.3%)
LIB - 123, +2 (34.7%, +0.4%)
NDP - 82, +1 (22.4%, -0.1%)
BQ - 4 (4.6%)
GRN - 1 (4.2%)
This gives a 40-45% chance of winning to the Liberals. Note that when a pollster provides likely voter figures, I use those (instead of my own adjustment) for the projection. I still use the eligible voter figures for the unadjusted projection below:
LIB - 134 (35.6%)
CON - 113 (31.4%)
NDP - 84 (22.9%)
BQ - 6 (4.5%)
GRN - 1 (4.4%)
This gives the Tories a roughly 25% chance of winning.
Tomorrow morning, Léger and Mainstreet should release their final national polls of the campaign.
Nanos, Forum: Liberal Lead in ON is not Crazy; Lead Now Controversy
Today's Nanos and Forum polls align: the Liberals lead by 6 nationally, by 2 in QC, by 9-10 in ON, and by -1 over Tories and 3-4 over the NDP in BC. It's rare that there is such agreement!
The Ontario situation is interesting. Here are the Liberal leads in ON in the last poll published by Forum, Nanos and EKOS as of last morning, and as of this morning:
- Last morning: 15 (10/8-9), 16.7 (10/11, 13, 14), 18.1 (10/11-13)
- This morning: 9 (10/13-14), 10 (10/13-15), 10.7 (10/12-14)
Quite a different picture, isn't it? By the way, the other recent polls in ON are all over the map, with the Liberals leads as follows:
20 (Innovative, 10/6-11)
13 (Ipsos, 10/9-12)
7 (Abacus, 10/5-6)
7 (Mainstreet, 10/6-7)
3 (Léger, 10/5-7)
0 (Angus Reid, 10/7-9)
The common thread I see here is that Liberal numbers in ON were particularly good over Thanksgiving weekend. Conservative voters at family events and not picking up? Burst of enthusiasm from the Trudeau Brampton rally ad? Or just noise that happened to go the same way in multiple polls? In any case, the story seems to be that the Liberal ON lead has pulled back a little, but is still higher this week than it was last week.
Of course, the advantage of poll averaging is that these temporary lurches don't show up much: the Liberal ON lead is now pegged at 9.5% unadjusted, 6.2% adjusted. Both are only about 1 point lower than last morning.
There have also been three riding polls by Mainstreet in Alberta. The Liberals have a 1-point lead in Calgary Centre. That's the third Alberta poll having the Liberals tied or ahead in an Alberta riding: Mainstreet also showed a 1-point Liberal lead in Calgary Confederation last month, and a tie in Edmonton Mill Woods last week. Now, none of these is enough to swing the projection to show a Liberal seat - the turnout adjustment would mean marginal Liberal losses, and when the projection and a riding poll conflicts, I take an average of the two. But I am giving a seat to the Liberals in Alberta because:
- with 3 very tight races, the chances are decent that they'd break through in at least one; and
- the best Liberal riding in AB in 2011, Calgary Skyview, has not yet been publicly polled; since the Liberal candidate is stronger than expected in other good Liberal ridings, it's not a big stretch to think that Calgary Skyview has a good chance of falling to the Liberals.
In other words, the Liberals have decent chances in at least 4 Alberta ridings. Even if you believe that, for any given one of them, they are more likely to lose than to win, you might also believe that they'll probably come out ahead in at least one of them. At this point, that is my assessment.
So the new projection is:
CON - 131, -2 (33.4%)
LIB - 121, +2 (34.3%, +0.2%)
NDP - 81 (22.5%)
BQ - 4 (4.6%)
GRN - 1 (4.2%, -0.1%)
Unadjusted, I get no seat change from last night:
LIB - 131 (35.2%)
CON - 116 (31.7%)
NDP - 83 (23.2%)
BQ - 7 (4.6%)
GRN - 1 (4.4%)
Finally, a word about Vancouver Granville and the Lead Now controversy: the party with the best chance of defeating the Tories there is the Liberal Party: it leads the NDP by 2 and 16 points in riding polls this month, and models based on aggregate BC numbers also suggest that the Liberals are ahead. Lead Now needs to decide whether it is a strategic voting organization, or an interest group pushing left-wing values. Mixing the two is clumsy and misleading to voters.
Thursday, October 15, 2015
Weekly Trends: Tories Slide, Liberals Climb, NDP Levels Off
Here are the weekly trends (a day early, since I'll post the final trends in 3 days anyway).

The vote share trends (adjusted for turnout) tell a similar story, but the Liberals have been ahead for a few days:


(In case you're new to this blog, the dotted lines refer to projections that did not take riding polls and sub-regional breakdowns into account.)
After flirting with the 150-seat level in the first few days of October, the Tories started pulling back last week, and their decline accelerated this week. Meanwhile, the Liberals have continued their steep ascent. Note that the only polls ending on Oct. 13 and 14 are the rolling EKOS and Nanos polls, so it is too early to say that the Conservative fall and/or the Liberal rise have stopped.
The NDP, however, has been essentially flat for five days, so it appears that it has settled around 80 seats. In Québec, the NDP stopped its slide just before disaster: with a current poll average just under 30%, it still stands to win roughly half of the seats in Québec. However, Quebecers may not have said their last word yet.
The vote share trends (adjusted for turnout) tell a similar story, but the Liberals have been ahead for a few days:

It's interesting to note that despite being about 6 full points lower than where the Liberals were during most of September, the NDP is only about 10 seats lower. This is almost entirely due to Québec: elsewhere in the country, the NDP is projected to win only 40 seats, about the same (especially if you consider that the total number of seats has increased) as it did in 2008, before the orange wave. Thus, outside Québec, the NDP is almost down to its base; in Québec, is 28-30% its new base? We may find out in the negative in the next few days; if not, we likely won't find out before the next election...
EKOS: Tight Race; BC Riding Polls
Today's EKOS poll shows that the Liberal lead has shrunk from 4.2 points to 0.9 points. In ON, the Liberal lead is 10.7; that's a healthy lead, but not the 18.1 from yesterday. The NDP maintained a good level in Québec (34%), but lost its very temporary lead in BC; overall, it gave back 1/3 of its gains from yesterday, suggesting that it has not started a surge.
Mainstreet and Insights West both published a batch of BC riding polls. As a result, I am making these riding adjustments (expressed with respect to existing regional adjustments; all adjustments are listed here, here and here):
Burnaby North--Seymour: CON +5, LIB -5
Esquimalt--Saanich--Sooke: NDP +5, LIB -5
Vancouver South: CON +5, LIB -5
To balance out these and previous riding adjustments in BC: NDP -0.5, LIB +0.5 in all of BC
These developments are generally favourable to the Conservatives, who claw back most of their losses from this morning's update:
CON - 133, +4 (33.4%, +0.2%)
LIB - 119, -3 (34.1%, -0.1%)
NDP - 81, -1 (22.5%, -0.2%)
BQ - 4 (4.6%)
GRN - 1 (4.3%, -0.1%)
With these numbers, we're talking a 30-35% chance of the Liberals being in the lead.
The unadjusted projection is:
LIB - 131 (35.0%)
CON - 116 (31.7%)
NDP - 83 (23.1%)
BQ - 7 (4.6%)
GRN - 1 (4.6%)
This is essentially the opposite of the adjusted projection: 30-35% chance of a Conservative lead.
I'm guessing that starting tomorrow, we should get an avalanche of various pollsters' final polls. If all firms that have published a national poll during the campaign decide to have a final say, we'll get 8 national polls (Abacus, Angus Reid, Environics, Forum, Innovative, Ipsos, Léger, Mainstreet) on top of the daily Nanos and EKOS surveys. We may also get provincial/regional polls from CRA (Atlantic), CROP (Québec) and Insights West (BC, Alberta).
I will post trends this evening to provide a good idea of how we got to where we are now. Tomorrow, Saturday and Sunday, I will do the standard two updates each day. There will be an additional final update late Sunday night / wee hours of Monday, and hopefully (if I'm not too tired by that point) some analysis posts (trends, strategic voting, things to watch for election night) throughout Election Day. I also hope to provide an interim projection around 9:00-9:15pm ET based on Atlantic results, just before polls close in most of the country. So stay tuned for some exciting days!
Nanos, Innovative: Liberals by 17, 20 in ON; Some Adjustments
Yesterday, I wrote that the 18-point Liberal ON lead in the EKOS poll was "almost certainly too large." Well, today, Nanos has the Liberals up by almost 17 points there, and an Innovative poll conducted late last week had the Liberals up by 20 points in Ontario! This explains the majority chatter in some pollsters' tweets - and from Justin Trudeau himself. This also explains why Trudeau asked for a majority in French: even if he were to win 90 seats in Ontario, he would still need a breakthrough in Québec, and no poll has had him higher than 31% there.
The blockbuster ON numbers boost the Liberal national lead to 6.7 and 8 points in these polls.
The unadjusted polling average retains a healthy amount of skepticism; it has the Liberals up by 3.7 points nationally, and by 10.5 points in ON. With the turnout adjustment, it's 1.0 and 7.3.
Two adjustments have been made to the projection model:
There have been two more riding polls by Oraclepoll in Northern Ontario, and they argue against that the Northern Ontario adjustment favouring the Liberals (which was based on Mainstreet's October 1 Ontario megapoll). These are on top of the Environics poll that made me cancel the adjustment for Kenora only. As a result, I have decided to cancel the Northern Ontario adjustment for all ridings. This benefits the NDP, and has a domino effect on the rest of Ontario so that things balance out:
- The City of Toronto adjustment (CON +5, LIB -5) is maintained.
- To balance things out, it's now CON -1 and LIB +1 in the 905, and CON -1.5 and LIB +1.5 in Ontario outside the GTA and Northern Ontario.
The other modeling change I'm making was planned all along: since there will be an avalanche of big polls in the coming days, there will be less need to include older polls to decrease statistical uncertainty. They will therefore be discounted more quickly. The 5 most recent polling days will continue to retain full weight. Up until yesterday, each earlier polling day had its weight reduced by 1/10, so that 9 days were counted at partial weight, for a total of 14 days with weight. Starting today, the number of days with partial weight will be reduced by 1 on the first update of each day. Thus, today's projection is based on 13 days of polling, etc. Sunday's morning projection will be based on 10 days of polling, and the final projection will be based on the last 9 days of polls (i.e. days 6-9, counting backwards, will be weighted at 0.8, 0.6, 0.4 and 0.2).
Unsurprisingly, due to the shift in Ontario, the new projection moved against the Conservatives:
CON - 129, -5 (33.2%, -0.2%)
LIB - 122, +4 (34.2%, +0.5%)
NDP - 82, +2 (22.7%, -0.1%)
BQ - 4, -1 (4.6%, -0.2%)
GRN - 1 (4.4%, +0.1%)
On these numbers, the Liberals have a 40% chance of being in the lead.
Without the turnout adjustment, the Liberals widen their lead:
LIB - 133 (35.1%)
CON - 113 (31.4%)
NDP - 84 (23.2%)
BQ - 7 (4.6%)
GRN - 1 (4.6%)
These numbers imply a 75% chance of the Liberals being ahead.
Wednesday, October 14, 2015
EKOS: NDP Up; Liberals by 18 in Ontario
Today's EKOS poll shows a huge bump for the NDP: 3.5 points, even though only 1/3 of the sample was updated from yesterday. The NDP is suddenly back ahead in Québec by 11.8 points and in BC by 4.5 points. Is this bump the start of a new trend? Remember that today's Nanos poll showed no big change for the NDP. For now, the prudent hypothesis is that this is merely mean reversion, as EKOS has had the NDP lower than most other pollsters.
This poll also contains good news for the Liberals, who have a whopping 18.1-point lead in ON. That is almost certainly too large, but does suggest that the 12-point lead seen by other pollsters may be close to the truth. My polling average has the Liberals ahead by 8.8 in Ontario, or 5.5 after the turnout adjustment.
The new projection has the NDP back up a bit:
CON - 134, -1 (33.4%, -0.1%)
LIB - 118 (33.7%, -0.1%)
NDP - 80, +2 (22.8%, +0.2%)
BQ - 5, -1 (4.8%, +0.1%)
GRN - 1 (4.3%)
This is the first decrease of the campaign for the Bloc. The NDP appears to have leveled off around 80 seats.
The unadjusted projection is now:
LIB - 129 (34.5%)
CON - 118 (31.7%)
NDP - 82 (23.4%)
BQ - 8 (4.7%)
GRN - 1 (4.6%)
Stability in Nanos; Riding Polls
Today's Nanos mostly shows stability, meaning that numbers on Oct. 13 were similar to those on Oct. 9. But Oct. 9 was the day that produced a large drop in Conservative support, and some were wondering if that was a blip due to people having left home for the holiday weekend Friday night. It now looks like that wasn't a blip.
A number of riding polls have been released over the past few days. I have reviewed them, and updated the adjustments made to the model as follows (existing adjustments are listed here and here):
Alberta
Edmonton Centre (update): CON +5, NDP +5, LIB -10
Edmonton Mill Woods (new): CON -5, NDP -5, LIB +10
British Columbia (these are relative to the regional adjustment)
Cariboo--Prince George (new): CON -6, NDP +3, LIB +3
Coquitlam--Port Coquitlam (new): CON -5, NDP +5 [note: James Moore not running for re-election]
North Okanagan--Shuswap (new): NDP +5, GRN -5
Vancouver Granville (update): CON +5, NDP +5, LIB -10
Ontario (these are relative to the regional adjustment; Brampton East in the previous post was expressed relative to ON average)
Essex (new): NDP +5, LIB -5
Kenora (cancel Northern Ontario adjustment): NDP +5, LIB -5
Peterborough--Kawartha (new): CON -5, LIB +5
Spadina--Fort York (new): NDP -2.5, LIB +5, GRN -2.5
Québec
Chicoutimi--Le Fjord (update): CON -5, NDP +5
Jonquière (update): CON -10, LIB +5, BQ +5
Notre-Dame-de-Grâce--Westmount (new): CON -5, NDP +5, LIB -5, BQ +5
Pontiac (new): CON -5, LIB +5
The net effect of all these changes is that the Liberals inch closer to the Tories:
CON - 135, -2 (33.5%, -0.1%)
LIB - 118, +2 (33.8%, +0.2%)
NDP - 78 (22.6%, -0.1%)
BQ - 6 (4.7%, -0.1%)
GRN - 1 (4.3%)
On these numbers, the Liberals have a 25-30% chance of being ahead. The Liberal lead in the unadjusted projection has quadrupled:
LIB - 128 (34.7%)
CON - 120 (31.7%)
NDP - 81 (23.2%)
BQ - 8 (4.7%)
GRN - 1 (4.6%)
On these numbers, the Liberals have roughly a 60% chance of being ahead.
Tuesday, October 13, 2015
Ipsos, EKOS: All Liberals
Today's polls, conducted over the holiday weekend, are to be taken with a grain of salt. However, they match grumbles that have been coming out of the Conservative campaign.
Both EKOS for iPolitics and Ipsos for Global show the Liberals ahead nationally by around 5 points, with:
- 50% or better in Atlantic Canada
- a marginal lead in Québec
- a double-digit lead in Ontario
- around 30% on the Prairies
- a lead in BC.
The NDP slide appears to have slowed or stopped. The Tories had low numbers in these polls. Holiday effect or real shift? The next few days will tell us more. (Note that EKOS shifted to IVR only on Sunday and Monday, which should have benefited the Tories.)
Interestingly, Ipsos had the Greens at 3% in BC, while EKOS has them at 18.7%. This basically cannot be explained by statistical noise, even with small samples.
All this of course had a large effect on the projection:
CON - 137, -5 (33.6%, -0.5%)
LIB - 116, +7 (33.6%, +0.6%)
NDP - 78, -2 (22.7%, +0.1%)
BQ - 6 (4.8%)
GRN - 1 (4.3%, -0.3%)
The Liberals have caught up with the Tories in the adjusted national vote share, and have taken a marginal lead in the unadjusted projection below:
LIB - 125 (34.5%)
CON - 123 (31.8%)
NDP - 80 (23.3%)
BQ - 9 (4.8%)
GRN - 1 (4.6%)
Things appear to be moving. If polls in the next two days confirm these trends, the Liberals would quickly catch up in the adjusted projection.
Monday, October 12, 2015
Understanding Projections II: Uncertainty
This is the second post of a two-part series on understanding projections. The first post, which explains why projections currently disagree on which party is leading, is available here.
The chances that any given projection model will hit the exact seat count is close to zero. So if a projection tells you that party A leads party B by 20 seats, is it a close race? Or is party B basically out of the running?
This post provides a back-of-the-envelope argument for determining the uncertainty of the national seat count of the three main parties for the 2015 election. The main conclusions are:
- For this election, the standard error on the main parties' seat counts is roughly 15-20 seats. This implies that the 95% confidence interval should extend 30-40 seats in either direction, and that the standard error on the difference between two parties is about 30 seats. Thus, a 20-seat lead by a party means a lead of about 2/3 of a standard deviation, which translates to a roughly 75% chance of winning (if the 3rd party is not in contention) assuming a normal distribution. The approximate probabilities that I have been providing in my posts are based on this rough calculation. (Currently, I think that the Liberals have a 15% chance of winning if you take my adjusted projection as your best guess, and 40% chance if you take my unadjusted projection as your best guess.)
- Of the models providing seat ranges and probabilities, The Globe's Election Forecast gives the most reasonable estimates. Too Close to Call, The Signal and Le calcul électoral also run simulations to account for uncertainty, but their simulations appear to be miscalibrated and most likely understate the extent of the uncertainty. (I should mention that Too Close to Call's riding-level uncertainties are credible and highly recommended.) ThreeHundredEight's ranges are not based on simulations, and are difficult to interpret in terms of probabilities. (Links to all of these websites are available on the left.)
Where does the "15-20 seats" come from?
As we know, polls are not exact. Part of the issue is sample size, which determines a poll's reported "margin of error." But a greater issue is turnout: pollsters in Canada do not have a good handle on who is actually doing to show up. (There's also movement in voting intentions as a poll is being conducted.) Therefore, even very large polls and their aggregation come with a significant degree of uncertainty.
How much is an average of polls likely to be wrong? Helpfully, ThreeHundredEight.com's methodology page tells us that in recent Canadian elections, its poll average was off by an average of 2.15 points per party. How does this relate to the standard deviation for main parties in a federal election?
- For a normal distribution, the average deviation is roughly 80% of the standard deviation. So this would bump up the estimate of the standard error to 2.7 points.
- Standard errors for parties closer to 50% are bigger than for smaller parties. So the 2.7 points estimate understates the standard error for large parties.
- There are more polls in a federal election, which reduces the sample-size related error.
I would venture that the latter two effects roughly cancel each other out, so the standard deviation on the support of the Liberals, Conservatives and NDP is probably, say, 2.5 to 3 points.
If the parties' support levels were independent, to get the standard deviation on the difference between two parties' support, one would multiply the above numbers by sqrt(2). But independence is clearly violated: if a party outperforms polls, other parties are likely to underperform them. Therefore, the true standard deviation on the difference between two parties is a bit bigger: roughly 4 to 5 points, if you believe the assumptions made so far.
How many seats is that? At most times during this campaign, there have been 50-55 races decided by under 4 points, and 65-70 races decided by under 5 points (though these figures are currently a bit higher). Roughly speaking, each of the main parties is winning 30% of them, and losing 30% of them. Thus, I estimate that a party stands to gain/lose 15-20 seats on a one-standard-deviation error.
What about other sources of uncertainty?
There are indeed other sources of uncertainty, e.g. arising from the transposition of regional vote shares into seats. But they are relatively small, and roughly independent from the uncertainty on the national vote share. Therefore, accounting for them would add little to the estimate above.
(Clarification: If the standard error from poll inaccuracy/noise is 18 (variance 324), and the standard error from independent factors is, say, 7 (variance 49), then the total standard error would be roughly 19.3 (variance 324+49=373), not much more than the 18 from polls.)
There are so many assumptions in the above calculations! Is there an independent way of getting the "15-20 seats" estimate?
I've been doing seat projections using a similar methodology since the 2004 election (just for fun, sharing with my buddies, before 2011). Here's how much the final projection was off each time:
- In 2004, the Liberals were underestimated and the Tories were overestimated by around 20 seats.
- In 2006, the Liberals were underestimated and the Tories were overestimated by around 10 seats.
- In 2008, the Liberals were overestimated and the Tories were underestimated by 12-15 seats.
- In 2011, I missed the Liberal, NDP and Tory seat counts by 9 to 14, despite adjustments that improved the accuracy of the model. Indeed, as you can see here, most other models fared worse, sometimes by a lot.
I think it is pretty clear that any claim of a standard deviation under 10 seats, which implies 95% confidence intervals extending less than 20 seats in each direction, is implausibly optimistic. Yet, the confidence intervals provided by Too Close to Call, Le calcul électoral, as well as most of the ones given by The Signal, are this small.
Why are those three sites wrong?
Firstly, I'd like to say that the three sites I mention run simulations to get their ranges, which is in principle much better than the back-of-the-envelope calculations I posted here. The problem is that their simulations appear to be miscalibrated.
- For Too Close to Call, I've had a conversation with Bryan Bréguet, and the problem appears to be that errors in each polling region (Atlantic, Québec, Ontario, MB/SK, Alberta, BC) are treated as fully independent. In reality, a party outperforming the polls in a given region is also more likely to do so in other regions - many factors are common across regions (age of supporters and other socio-economic characteristics, enthusiasm, etc.). Thus, while his simulations yield the right uncertainty in each region, they underestimate the national uncertainty: errors in different regions cancel themselves out more than they do in reality.
- Le calcul électoral does a wonderful job accounting for model uncertainty and statistical uncertainty. (It also deserves props for exemplary transparency in the description of its methodology.) However, it misses turnout uncertainty, which, as explained above, is the dominant problem here.
- Unfortunately, The Signal's methodology is not described in sufficient detail for me to figure out where the problem lies. But its ranges for the national popular vote seem too narrow.
Nanos: Liberals Up in Ontario
Two notes to start:
- Why do projections disagree on who's ahead? See this post for an explanation.
- It's the last day of advanced polls, from noon to 8pm local time! For those of you interested in strategic voting (polls suggest ~30% of you are), see my guide for the advanced polls. It was written Thursday night, and does not take into account polls released subsequently.
Today's Nanos further diverges from EKOS: the Liberals' national lead increases slightly to 6.8%, but more importantly, it is now at 12.5% in Ontario. So who's right? Are the Liberals up by double digits in ON (Innovative 12%, Forum 15%)? Or is ON a tight race (Angus Reid tie, EKOS has Tories ahead by 0.5%)? The answer to this question determines who's the true current seat count leader.
The projection, of course, comes somewhere in the middle: it has the Liberals up by 6.1% in ON, or 2.8% adjusted for turnout.
CON - 142, -1 (34.1%, -0.1%)
LIB - 109, +1 (33.0%, +0.2%)
NDP - 80 (22.6%, -0.1%)
BQ - 6 (4.8%, +0.1%)
GRN - 1 (4.6%)
The unadjusted projection sees the Liberals within 9 seats of the Tories:
CON - 128 (32.4%)
LIB - 119 (33.9%)
NDP - 82 (23.2%)
BQ - 8 (4.7%)
GRN - 1 (4.8%)
Depending on which projection you believe, the Liberals have a 15-40% chance of leading the seat count in the past few days.
There is no EKOS update this afternoon due to Thanksgiving. (Happy Turkey Day!) Usually, Global comes out with an Ipsos poll at 4pm ET/1pm PT on Monday, but it's unclear whether that'll happen today due to the holiday. If it does, I will update the projection this afternoon. If it doesn't, I'll write the second part of the series on understanding projections, which explains where I get the above probabilities from and why I think other websites, with the notable exception of The Globe's Election Forecast, get probabilities/seat ranges wrong.
Sunday, October 11, 2015
EKOS: Tories Take 2.4-Point Lead
Today's EKOS poll is the first genuinely good one for the Tories in a while. They are just 12 points back of the Liberals in the Atlantic, just 3 points back of the NDP in Québec (with the Liberals in between), and 7 points ahead of the NDP in BC (where the Liberals are first, but where there are lots of Conservative/NDP races). Most importantly, this is the first poll in 9 days showing the Tories ahead in Ontario, albeit by an insignificant 0.5 points.
This is also a very bad poll for the NDP: just 19% nationally, 14.2% in ON and 22.2% in BC. This poll nudges the NDP to third place in the BC polling average (note that the weight on this poll is only about 8% - this third place in BC has been a long time coming). The only bright spot is Québec, where they are back in first place (though at a low 27.1%) and 13 points ahead of the Bloc.
This morning, we were wondering if EKOS would confirm or cast doubt on the continued Liberal surge that Nanos and Forum seemed to show. The latter has happened. This poll is not actually bad in an absolute sense for the Liberals (except in the Atlantic, where the sample is tiny) - just bad relative to the Tories that they need to beat.
The updated projection is:
CON - 143, +2 (34.2%, +0.2%)
LIB - 108, -1 (32.8%)
NDP - 80, -1 (22.7%, -0.2%)
BQ - 6 (4.7%, -0.1%)
GRN - 1 (4.6%, +0.1%)
This is the first day in a week where the Conservative projection has increased, and where the Liberal projection has failed to do so. The NDP has fallen in 7 consecutive days, and failed to increase in 20 consecutive days.
The unadjusted seat projection is actually unchanged:
CON - 129 (32.4%)
LIB - 117 (33.7%)
NDP - 83 (23.3%)
BQ - 8 (4.7%)
GRN - 1 (4.9%)
The gap between the adjusted and unadjusted projections has widened. Why? It just so happens that at the current regional numbers, there are inordinately many tight races. In my projection, 30 races are currently being decided by less than 2 points, and 70 by less than 5 points. That's 70 tossups! As the EKOS write-up suggests, turnout is going to be key.
Forum, Nanos: Liberals by 6
Two notes to start:
- Why do projections disagree on who's ahead? See this post for an explanation.
- For those of you interested in strategic voting (polls suggest ~30% of you are), see my guide for the advanced polls. It was written Thursday night, and does not take into account polls released subsequently.
- Why do projections disagree on who's ahead? See this post for an explanation.
- For those of you interested in strategic voting (polls suggest ~30% of you are), see my guide for the advanced polls. It was written Thursday night, and does not take into account polls released subsequently.
Another day, another good poll for the Liberals. This time it's the most recent Forum poll, where the Liberals are up 2 and the NDP is down 3 since three days ago. Other than the Atlantic results, this poll is stellar for the Liberals across the board: a 4-point lead over the NDP in QC, a 15-point(!) lead in ON, and a high number of 32% across Western Canada.
Nanos has the Tories back up to a more respectable 33% in ON, which is still well back of the Liberals at 42%.
Somewhat surprisingly, the Liberals do not gain seats in the new projection:
CON - 141, +1 (34.0%, -0.1%)
LIB - 109 (32.8%, +0.4%)
NDP - 81, -2 (22.9%, -0.2%)
BQ - 6, +1 (4.8%, +0.1%)
GRN - 1 (4.5%, -0.1%)
This is probably just a quirk of how the 2011 results were distributed across ridings. Indeed, the unadjusted projection does show gains for the Liberals:
CON - 129 (32.3%)
LIB - 117 (33.7%)
NDP - 83 (23.5%)
BQ - 8 (4.8%)
GRN - 1 (4.8%)
What Forum and Nanos both suggest is that the Liberals were doing better late in the week than early in the week. We'll find out this afternoon if EKOS saw the same thing.
Saturday, October 10, 2015
Understanding Projections I: Uniform vs. Proportional Swing
(Note: For those of you interested in strategic voting (polls suggest ~30% of you are), see my guide for the advanced polls. It was written Thursday night, and does not take into account polls released subsequently.)
No EKOS update today (apparently there has been virtually no change), so instead of a projection update, here's a post to help you understand why projections differ.
This is the first post of a two-part series on understanding projections. The second post, on how to interpret projections in terms of probabilities,will be available in a few days is available here.
Building a projection model involves many decisions: how to weigh polls (sample size, recency, pollster accuracy, etc.), whether/how to incorporate sub-regional breakdowns and riding polls, whether/how to account for incumbency and star candidates, what to use as a baseline (just the last election or also give weight to historical results), etc. But most of the variation across different publicly available models for this election comes down to one thing: whether the model is based on uniform swing or proportional swing.
What is uniform swing?
Uniform swing assumes that if a party goes up/down by X points in a region, then it goes up/down by X points in every riding in that region. For example, if the Liberals increase from 13.4% to 26.8% in BC, uniform swing would add 13.4% to the Liberal vote share in every BC riding. (Note that the Liberals are, in fact, currently a bit higher than 26.8%.)
What is proportional swing?
Proportional swing assumes that if a party goes up/down by fraction X in a region, then it goes up/down by fraction X in every riding in that region. For example, if the Liberals increase from 13.4% to 26.8% in BC, proportional swing would double the Liberal vote share in every BC riding.
OK, I get the difference. Does it really matter?
It does not matter much when no party went from really low to competitive (or vice versa) in any region. But that's not the case this time: the Liberals more than doubled their support in the West relative to 2011, and almost doubled it in Québec. In such cases, it can matter a lot. Take the BC example from above, and consider a riding where they had 20% in 2011. With uniform swing, they would be projected to get 33.4% of the vote - sufficient on win only in a three-way race. With proportional swing, they are instead projected to get 40% of the vote - sufficient to win most races.
Here is a list of the most recent projections:
No EKOS update today (apparently there has been virtually no change), so instead of a projection update, here's a post to help you understand why projections differ.
This is the first post of a two-part series on understanding projections. The second post, on how to interpret projections in terms of probabilities,
Building a projection model involves many decisions: how to weigh polls (sample size, recency, pollster accuracy, etc.), whether/how to incorporate sub-regional breakdowns and riding polls, whether/how to account for incumbency and star candidates, what to use as a baseline (just the last election or also give weight to historical results), etc. But most of the variation across different publicly available models for this election comes down to one thing: whether the model is based on uniform swing or proportional swing.
What is uniform swing?
Uniform swing assumes that if a party goes up/down by X points in a region, then it goes up/down by X points in every riding in that region. For example, if the Liberals increase from 13.4% to 26.8% in BC, uniform swing would add 13.4% to the Liberal vote share in every BC riding. (Note that the Liberals are, in fact, currently a bit higher than 26.8%.)
What is proportional swing?
Proportional swing assumes that if a party goes up/down by fraction X in a region, then it goes up/down by fraction X in every riding in that region. For example, if the Liberals increase from 13.4% to 26.8% in BC, proportional swing would double the Liberal vote share in every BC riding.
OK, I get the difference. Does it really matter?
It does not matter much when no party went from really low to competitive (or vice versa) in any region. But that's not the case this time: the Liberals more than doubled their support in the West relative to 2011, and almost doubled it in Québec. In such cases, it can matter a lot. Take the BC example from above, and consider a riding where they had 20% in 2011. With uniform swing, they would be projected to get 33.4% of the vote - sufficient on win only in a three-way race. With proportional swing, they are instead projected to get 40% of the vote - sufficient to win most races.
Here is a list of the most recent projections:
C-L-N-B (all models give the Greens one seat)
Date = last day of polling included
Links to all these sites are in the blog roll on the left.
Links to all these sites are in the blog roll on the left.
129-115-86-7 (Canadian Election Watch, unadjusted, 10/9)
131-113-91-2 (Too Close to Call, 10/9)*
127-115-88-7 (Le calcul électoral, 10/8)
127-115-88-7 (Le calcul électoral, 10/8)
123-113-98-3 (LISPOP, 10/4)
(The Globe's Election Forecast, which provides probabilities, is also based on uniform swing.)
*Includes slight turnout adjustment (smaller than this blog's).
*Includes slight turnout adjustment (smaller than this blog's).
Proportional swing models
122-131-80-4 (Three Hundred Eight, 10/9)
130-136-67-4 (The Signal, 10/9)
126-129-80-2 (Election Almanac, 10/8)
123-125-81-8 (Election Atlas, 10/8)
Methodology not found
125-133-77-2 (Predictionator by David Akin, 10/9)
131-110-96-0 (CVM Election Model, 10/7 - this one is almost certainly uniform)
All uniform swing models have the Conservatives leading. All proportional swing models have the Liberals leading. (Update 10/12: The Globe's Forecast now appears to have the Liberals marginally ahead, partly due to its model now assigning zero weight to polls more than one week old.) Variations within each category exist, but they are slight compared to the differences across categories.
Which method is better?
Obviously, I believe in uniform swing since that's the method I chose. On actual election results, uniform swing has historically performed very well. In 2011, uniform swing (clarification: that is, my version of uniform swing, which included an adjustment for the Toronto area) would have, given the actual regional vote shares, projected every party's total seat count outside Québec within 3. It's hard to do any better than that! (In Québec, the NDP would have been underestimated, but I believe that proportional swing would have done so as well, perhaps by more.)
However, in most elections, proportional swing would have also done very well, so it's very hard to say definitively that one method is better than the other. This election may provide a good test, particularly with respect to Liberal results in Western Canada.
I would encourage Liberal/Green supporters to take uniform swing seriously, and Conservative/NDP supporters to take proportional swing seriously. This way, you won't be too disappointed come election night!
Angus Reid: Small Tory Lead; Nanos: Tories Drop
(Note: For those of you interested in strategic voting (polls suggest ~30% of you are), see my guide for the advanced polls. It was written Thursday night, and does not take into account polls released subsequently.)
Today's Angus Reid poll gives a marginal lead to the Conservatives nationally, and shows a tie in ON. These are actually not bad news for the Liberals: Angus Reid has had them much lower than other pollsters in every poll it has released this campaign. In August, polls within one week (either way) from the Angus Reid poll had the Liberals at 26-30% nationally and 30-34% in ON; Angus Reid had 24% and 28% 29.5% (28% was among likely voters) respectively; last week, while other pollsters had the Liberals at 32-40% in ON, Angus Reid had them at 28% there. Now, Angus Reid has one of the best track records out there; this election will either cement it (if Liberals indeed underperform) or tarnish it (if everyone else is right).
Other noteworthy tidbits from the Angus Reid poll: the Bloc is at 27% in Québec (though still behind the NDP at 31%), and the NDP is at 36% in BC. The former is a campaign high for the Bloc - no other poll has shown them above 24% in QC, while the latter is the best NDP result in BC since... last week's Angus Reid poll.
The daily Nanos, meanwhile, shows a 2.4% Conservative drop nationally and a 3% drop in ON to 30.7%, a new low for the Tories in the Nanos daily tracking. Nanos now shows the Liberals with 10-point lead in ON. In Québec, after spending 5 days at 30%, the NDP got an uptick to 32%. Finally, in BC, the Greens jumped to a new Nanos daily tracking high of 14.9%.
Adding these polls (and, importantly, reducing the weight on last week's Angus Reid) yields a further Liberal rise:
CON - 140, -1 (34.1%, -0.2%)
LIB - 109, +2 (32.4%, +0.2%)
NDP - 83, -2 (23.1%, -0.1%)
BQ - 5, +1 (4.7%)
GRN - 1 (4.6%, -0.1%)
With these numbers, the probability of a Liberal win is about 15%.
Without the turnout adjustment, it's of course even tighter:
CON - 129 (32.4%)
LIB - 115 (33.3%)
NDP - 86 (23.8%)
BQ - 7 (4.7%)
GRN - 1 (4.9%)
With these numbers, the Liberals have a one-in-three chance of winning.
Friday, October 9, 2015
Week in Review: Liberal Surge
(Note: For those of you interested in strategic voting (polls suggest ~30% of you are), see my guide for the advanced polls. It was written Thursday night, and does not take into account polls released subsequently.)
(Update late 10/9: Angus Reid 10/7-9 poll)
Late last week, the Conservatives appeared to be running away with the election. Now, the Liberals are duking it out with the Tories for the popular vote lead, and if the current trends continue, by the end of next week, they will be fighting for the seat count lead. However, if the NDP is approaching its floor in Ontario, the next 20 seats may be tougher for the Liberals to gain than the 20 it gained this week.
First, a summary of the latest national numbers from the 9 pollsters in the field this past week:
L-C-N
32-33-26 (Ipsos, 10/2-4)
32-33-24 (Abacus, 10/5-6)
35-31-26 (Forum, 10/5-6)
34-30-25 (Léger, 10/5-7)
35-36-20 (Mainstreet, 10/6-7)
35-30-24 (Innovative, 10/5-8)
34-31-25 (Nanos, 10/6-8)
33.8-33.7-20.4 (EKOS, 10/6-8)
31-33-25 (Angus Reid, 10/7-9)
The Liberal vote share ranges from 31% to 35%. However, the 32% results occurred early in the week, and the five of the six most recent polls are within a very narrow range of 33.8% to 35%, with Angus Reid being the outlier at 31%. The last unadjusted projection (issued before Angus Reid) pegged the Liberals at 33.1%, meaning that if their late-week numbers are sustained, the Liberals will keep gaining in the projection.
The Conservative vote share ranges from 30% to 33.7%, with Mainstreet putting it at 36%. The last unadjusted projection placed it at 32.6%. It looks like the Conservative vote is quite stable at this point.
The NDP vote share ranges from 24% to 26% in six polls, while Mainstreet and EKOS peg it at 20%. The last unadjusted NDP poll average was 23.9%. It will be interesting to see if its slide has stopped, as the Nanos tracking suggests, or if it is still ongoing, as the EKOS tracking suggests.
The adjusted vote share, which includes a turnout adjustment where Conservative supporters are roughly 10% more likely to vote than other electors, still favours the Tories, but the gap has shrunk in a hurry:

We can see that during almost all of September, NDP losses appeared to go to the Tories. Most likely some of it actually went to the Liberals, who probably lost some centre-right voters to the Conservatives. However, in the past 7 days, the Liberals gained 3.4 points thanks to a 2.7-point drop in NDP support (and a 0.6-point drop in Green support). The most obvious explanation - and likely the right one, though we can only speculate - is that these were "change" electors deciding that Trudeau is more likely than Mulcair to replace Harper.
All this of course has an impact on the seat projection:

I will write a post in the coming week about where these probability estimates come from. I believe that some of the other ones out there overstate the precision of seat projections, but The Globe's Election Forecast gets reasonable results (it shows a higher Liberal probability of winning because it does not include a turnout adjustment).
Below is a brief region-by-region overview:
- Atlantic: The Liberal vote share is roughly double the (very similar) NDP and Conservative support levels. It is difficult to know how things are distributed by province, but whatever happens, the Liberals should win 20-27 out of 32 seats here.
- Québec: A complete mess. The Bloc usually has problems with turnout, so it will have trouble coming out on top of this four-way race. The NDP probably still has a small edge over the Liberals, but don't be surprised if it goes away completely. The wild card is the Tories: are they at 17-23%, as phone/online polls suggest, or 23-27% as IVR polls suggest? Commentator Jean Lapierre believes that some Conservative supporters in Québec feel ashamed to admit that they will vote Tory, so perhaps the IVR polls are more correct. My adjusted average currently shows NDP 29%, LIB 25%, CON 24%, BQ 19%.
No regional breakdown has been offered in Québec for several weeks. However, Jean-Marc Léger says that the NDP is 2nd everywhere: in Montréal to the Liberals, in Quebec City to the Tories, and in the countryside to the Bloc. If that is borne out, the current NDP projected seat count of 41 would be a gross overestimate, and the Bloc might regain official party status.
- Ontario: The polls this week show:
L-C-N
38-35-24 (Ipsos, 10/2-4)
39-34.8-22.5 (Nanos, 10/3-5)
39.2-38-16.8 (EKOS, 10/3-5)
39-32-23 (Abacus, 10/5-6)
38-35-23 (Forum, 10/5-6)
37-34-24 (Léger, 10/5-7)
44-37-14 (Mainstreet, 10/6-7)
43-31-21 (Innovative, 10/5-8)
41.1-33.7-21.7 (Nanos, 10/6-8)
38.5-36.3-17 (EKOS, 10/6-8)
36-36-22 (Angus Reid, 10/7-9)
Unanimous agreement: if everyone turns out, Ontario is currently red. (Well, Angus Reid shows a tie, but Angus Reid has been low on the Liberals in ON throughout the campaign.) The Liberals were at 37-39% early in the week. Have they increased to the low 40s? This is THE question for the next few days. If so, they have a real chance of winning the election. But if they remain in the high 30s, it probably won't be enough. My adjusted average is currently skeptical, showing LIB 38%, CON 37%, NDP 20%. Look for a continued Liberal surge in the projection if today's Mainstreet, Innovative and Nanos numbers hold.
- MB/SK: Roughly speaking, these are to the Tories what the Atlantic provinces are to the Liberals. The bulk of tight races are Conservative/NDP ones in Regina and Saskatoon. The Liberals should get a healthy delegation from Winnipeg.
- AB: The NDP has dropped dramatically here, from 25-30% in late August to around 15% now. Proportionally, this is as dramatic a decline as it suffered in Québec! Some of the vote went back to the Tories, while some went to the Liberals, who are now above 20% in most polls. The current projection probably overestimates the Conservative seat count here: there's noise from insider pollsters that the Liberals are, in fact, poised to make gains, but there are no publicly available hard numbers showing that. Riding polls in the last week of the campaign may provide some clarity.
- BC: It's a three-way tie in the unadjusted numbers here, giving the Tories a marginal lead in the adjusted average: CON 32%, NDP 29%, LIB 29%. The Liberal vote is inefficient to the extreme here: it is very concentrated in a small number of ridings, which leaves most other ridings around 20-25%, not enough to win. As a result, the Liberals are stuck at 7 projected seats despite battling for first place in the vote share. The Greens remain stuck at 9-10%, though what we really need to figure out if they can win a second seat is a riding poll in Victoria - none has yet been publicly released.
(Update late 10/9: Angus Reid 10/7-9 poll)
Late last week, the Conservatives appeared to be running away with the election. Now, the Liberals are duking it out with the Tories for the popular vote lead, and if the current trends continue, by the end of next week, they will be fighting for the seat count lead. However, if the NDP is approaching its floor in Ontario, the next 20 seats may be tougher for the Liberals to gain than the 20 it gained this week.
First, a summary of the latest national numbers from the 9 pollsters in the field this past week:
L-C-N
32-33-26 (Ipsos, 10/2-4)
32-33-24 (Abacus, 10/5-6)
35-31-26 (Forum, 10/5-6)
34-30-25 (Léger, 10/5-7)
35-36-20 (Mainstreet, 10/6-7)
35-30-24 (Innovative, 10/5-8)
34-31-25 (Nanos, 10/6-8)
33.8-33.7-20.4 (EKOS, 10/6-8)
31-33-25 (Angus Reid, 10/7-9)
The Liberal vote share ranges from 31% to 35%. However, the 32% results occurred early in the week, and the five of the six most recent polls are within a very narrow range of 33.8% to 35%, with Angus Reid being the outlier at 31%. The last unadjusted projection (issued before Angus Reid) pegged the Liberals at 33.1%, meaning that if their late-week numbers are sustained, the Liberals will keep gaining in the projection.
The Conservative vote share ranges from 30% to 33.7%, with Mainstreet putting it at 36%. The last unadjusted projection placed it at 32.6%. It looks like the Conservative vote is quite stable at this point.
The NDP vote share ranges from 24% to 26% in six polls, while Mainstreet and EKOS peg it at 20%. The last unadjusted NDP poll average was 23.9%. It will be interesting to see if its slide has stopped, as the Nanos tracking suggests, or if it is still ongoing, as the EKOS tracking suggests.
The adjusted vote share, which includes a turnout adjustment where Conservative supporters are roughly 10% more likely to vote than other electors, still favours the Tories, but the gap has shrunk in a hurry:

A week ago, the Conservative lead of 5.5 points was at its widest of the campaign. Now, this lead is down to 2.1 points, a decrease of 62%. (Without the turnout adjustment, the lead has been completely wiped out, and the Liberals are marginally ahead.)
We can see that during almost all of September, NDP losses appeared to go to the Tories. Most likely some of it actually went to the Liberals, who probably lost some centre-right voters to the Conservatives. However, in the past 7 days, the Liberals gained 3.4 points thanks to a 2.7-point drop in NDP support (and a 0.6-point drop in Green support). The most obvious explanation - and likely the right one, though we can only speculate - is that these were "change" electors deciding that Trudeau is more likely than Mulcair to replace Harper.
All this of course has an impact on the seat projection:

The dotted lines refer to projections made before the inclusion of riding polls and sub-regional breakdowns.
The NDP is now lower than the Liberals have ever been in the past month. The Conservatives have come off their highs due to Liberal strength in Ontario, and their chances of a majority have roughly halved, from about 10% to about 5%. The Liberal chances of winning have increased roughly five-fold, from 2-3% to 10-15%. (All these probabilities are if the election had taken place mid-week last week or this week - the uncertainty for actual election day is of course greater.)
I will write a post in the coming week about where these probability estimates come from. I believe that some of the other ones out there overstate the precision of seat projections, but The Globe's Election Forecast gets reasonable results (it shows a higher Liberal probability of winning because it does not include a turnout adjustment).
Below is a brief region-by-region overview:
- Atlantic: The Liberal vote share is roughly double the (very similar) NDP and Conservative support levels. It is difficult to know how things are distributed by province, but whatever happens, the Liberals should win 20-27 out of 32 seats here.
- Québec: A complete mess. The Bloc usually has problems with turnout, so it will have trouble coming out on top of this four-way race. The NDP probably still has a small edge over the Liberals, but don't be surprised if it goes away completely. The wild card is the Tories: are they at 17-23%, as phone/online polls suggest, or 23-27% as IVR polls suggest? Commentator Jean Lapierre believes that some Conservative supporters in Québec feel ashamed to admit that they will vote Tory, so perhaps the IVR polls are more correct. My adjusted average currently shows NDP 29%, LIB 25%, CON 24%, BQ 19%.
No regional breakdown has been offered in Québec for several weeks. However, Jean-Marc Léger says that the NDP is 2nd everywhere: in Montréal to the Liberals, in Quebec City to the Tories, and in the countryside to the Bloc. If that is borne out, the current NDP projected seat count of 41 would be a gross overestimate, and the Bloc might regain official party status.
- Ontario: The polls this week show:
L-C-N
38-35-24 (Ipsos, 10/2-4)
39-34.8-22.5 (Nanos, 10/3-5)
39.2-38-16.8 (EKOS, 10/3-5)
39-32-23 (Abacus, 10/5-6)
38-35-23 (Forum, 10/5-6)
37-34-24 (Léger, 10/5-7)
44-37-14 (Mainstreet, 10/6-7)
43-31-21 (Innovative, 10/5-8)
41.1-33.7-21.7 (Nanos, 10/6-8)
38.5-36.3-17 (EKOS, 10/6-8)
36-36-22 (Angus Reid, 10/7-9)
Unanimous agreement: if everyone turns out, Ontario is currently red. (Well, Angus Reid shows a tie, but Angus Reid has been low on the Liberals in ON throughout the campaign.) The Liberals were at 37-39% early in the week. Have they increased to the low 40s? This is THE question for the next few days. If so, they have a real chance of winning the election. But if they remain in the high 30s, it probably won't be enough. My adjusted average is currently skeptical, showing LIB 38%, CON 37%, NDP 20%. Look for a continued Liberal surge in the projection if today's Mainstreet, Innovative and Nanos numbers hold.
- MB/SK: Roughly speaking, these are to the Tories what the Atlantic provinces are to the Liberals. The bulk of tight races are Conservative/NDP ones in Regina and Saskatoon. The Liberals should get a healthy delegation from Winnipeg.
- AB: The NDP has dropped dramatically here, from 25-30% in late August to around 15% now. Proportionally, this is as dramatic a decline as it suffered in Québec! Some of the vote went back to the Tories, while some went to the Liberals, who are now above 20% in most polls. The current projection probably overestimates the Conservative seat count here: there's noise from insider pollsters that the Liberals are, in fact, poised to make gains, but there are no publicly available hard numbers showing that. Riding polls in the last week of the campaign may provide some clarity.
- BC: It's a three-way tie in the unadjusted numbers here, giving the Tories a marginal lead in the adjusted average: CON 32%, NDP 29%, LIB 29%. The Liberal vote is inefficient to the extreme here: it is very concentrated in a small number of ridings, which leaves most other ridings around 20-25%, not enough to win. As a result, the Liberals are stuck at 7 projected seats despite battling for first place in the vote share. The Greens remain stuck at 9-10%, though what we really need to figure out if they can win a second seat is a riding poll in Victoria - none has yet been publicly released.
Innovative: Liberals by 5; EKOS: Dead Heat
This week's poll by Innovative Research for the Hill Times is the best one yet for the Liberals: a 5-point national lead, and a 12-point ON lead. Given the Conservative poll efficiency and the turnout adjustment, this is the kind of poll that the Liberals need to inch ahead in the projection. Like Léger, Innovative shows a tight NDP/Liberal race in Québec, followed by the Bloc and the Conservatives. It is also showing a three-way race in BC, where all three parties are now within 0.7% in the unadjusted poll average.
Today's EKOS is the first poll in a while containing some bad news for the Liberals: their slight national lead from yesterday has been erased, and their ON lead decreased to 2.2% (from 7.3% yesterday). Of course, at this point, this is not very meaningful - remember that this morning's Nanos had the Liberals increasing its national and ON leads.
The Liberals keep inching up in the projection:
CON - 141, -1 (34.3%)
LIB - 107, +1 (32.2%, +0.3%)
NDP - 85 (23.2%, -0.2%)
BQ - 4 (4.7%)
GRN - 1 (4.7%)
The projection projection unadjusted for turnout is:
CON - 132 (32.6%)
LIB - 112 (33.1%)
NDP - 87 (23.9%)
BQ - 6 (4.7%)
GRN - 1 (5.0%)
Note that I've compared the data from MB/SK, including this mega SK poll by Mainstreet, and the two provinces appear to be moving in very similar ways relative to 2011. (There is some very slight evidence that the Liberals are doing a bit better and the NDP a bit worse than expected in MB, with the opposite being true in SK, but we're talking 1-2 points, which could be just noise.) Thus no adjustment is needed there.
In a few hours, I will post the trends for this week. But you already know what's coming: there has been a Liberal surge! I'll also look at the situation in each region.
Nanos, Léger, Mainstreet: Liberal/Conservative Race Within Margin of Error
(Note: For those of you interested in strategic voting (polls suggest ~30% of you are), see my guide for the advanced polls. It does not incorporate the information from the polls described below.)
Three polls this morning! The Léger poll for The Globe and Mail shows the Liberals with a 4% national lead, but only a 3% lead in ON. This poll is most informative in Québec, which was oversampled. There, the NDP and Liberals are tied for the lead at 28%, with the Bloc at 23% and the Tories at 20%. The BC numbers are also interesting, with the Liberals opening up an 11-point lead over the NDP (no, I did not mess up the Liberal/NDP order)! Very small sample in BC though.
The Mainstreet poll for Postmedia is probably the most consequential one this morning; it has a huge sample of 5,630. It still shows the Tories leading, but by only 1 point, compared to 8 last week. In Ontario, the Liberals have a 7-point lead, a complete reversal from a 10-point deficit just last week. In this poll, however, the Liberals are third in BC, though all parties are within the margin of error there. Just like Léger and EKOS, Mainstreet has the Liberals in the lead in Québec, though in this case, it's tied with the Conservatives, with the NDP just two points behind.
Remember the good old days where the daily Nanos for CTV was a lottery as to which party would be first? It feels that way now in Québec! Speaking of Nanos, it has the Liberal lead back up to 3%, on the strength of an ON lead that widened to 7.4%.
All this is, of course, yet again good news for the Liberals, who jump by over 1 whole percentage point in the projection:
CON - 142 (34.3%, -0.1%)
LIB - 106, +5 (31.9%, +1.1%)
NDP - 85, -6 (23.4%, -0.8%)
BQ - 4, +1 (4.7%)
GRN - 1 (4.7%, -0.3%)
These numbers imply a 10-15% chance of the Liberals actually winning if the election were this week. (I will do a post on how to interpret projections next week - some websites seem overly sanguine regarding the predictiveness of seat projections based on polls.) In fact, the probability would be even higher if I drop last week's polls (instead of counting them at partial value). This election is coming down to the wire!
The unadjusted projection has the Liberals lead the popular vote for the first time of the campaign:
CON - 132 (32.7%)
LIB - 112 (32.8%)
NDP - 88 (24.1%)
BQ - 5 (4.6%)
GRN - 1 (5.0%)
As you can see, a tie in the popular vote gives the Tories a 20-seat advantage due to the efficiency of their vote. If you prefer the unadjusted projection (i.e. you don't believe my turnout adjustment), the Liberal odds of winning implied by these numbers is 25-30%.
Another update this afternoon with EKOS and Innovative. And then the weekly trends. The party never ends! (OK, it will on October 20.)
Thursday, October 8, 2015
Guide to Strategic Voting: Advanced Polls Edition
About half of non-Conservative supporters claim to be ready to vote strategically in order to beat the Conservatives. This is a guide for those voters. But mainly, this is entertainment for political junkies. So don't feel too dirty reading this if you're a Conservative! (In fact, if you're an anti-NDP Conservative, you can also use this guide to figure out when you might want to vote Liberal.)
A couple of disclaimers:
- If you want to vote strategically, it may be a good idea to wait until Election Day. If you have to vote early, do it, but understand that today's advice may be irrelevant or even counterproductive come October 19. I will be posting an updated guide on the eve of Election Day.
- Follow the advice below at your own risk and peril. I make no guarantee that this advice is correct. In fact, there will almost certainly be a few ridings where it is wrong. (Though, hopefully, it will be right in most cases.) So don't complain to me if things don't work out!
There are actually three strategic considerations for anti-Harper voters, and they sometimes conflict.
1. Vote to defeat the Conservative candidate at the riding level.
2. Vote for the party most likely to beat the Conservative seat count.
3. Vote for the party most likely to beat the Conservative popular vote.
People sometimes dismiss the popular vote as meaningless in our system. However, this time, it may be important post-election: if the Tories win the seat count, it'd be much easier for Justin Trudeau to claim legitimacy to govern if he wins the popular vote. This means that the Governor General may be more likely to give Trudeau a chance to form government (instead of calling a new election) after the rejection of a Conservative Throne Speech if the Liberals win the popular vote. If the only relevant strategic consideration for you is #3 (e.g. you live in a non-competitive riding and care about the popular vote), you do not need a guide: vote Liberal.
The more important considerations, however, are likely to be #1 and #2. That's what the rest of this post is about. There are 143 ridings where you may want to vote strategically to defeat a Conservative. They are distributed as follows:
BC (23/42): 13 vote NDP, 7 vote Liberal, 3 too close
AB (7/34): 5 vote Liberal, 1 vote NDP, 1 too close
SK (6/14): 6 vote NDP
MB (5/14): 4 vote Liberal, 1 vote NDP
ON (62/121): 53 vote Liberal, 4 vote NDP, 5 too close
QC (29/78): 8 vote NDP, 3 vote Liberal, 1 vote Bloc, 17 too close
NB (4/10): 4 vote Liberal
NS (3/11): 3 vote Liberal
PE (1/4): 1 vote Liberal
NL: none
Territories (3/3): 2 vote Liberal, 1 vote NDP
Total outside Ontario: 30 vote NDP, 29 vote Liberal, 1 vote Bloc, 21 too close
Grand total: 82 vote Liberal, 34 vote NDP, 1 vote Bloc, 26 too close
As you can see, the advice is heavily skewed towards the Liberals, but that's entirely due to Ontario. Outside Ontario, the Liberal and NDP overall popular support levels are similar, so as one would expect, the strategic voting advice splits roughly evenly. The other interesting observation is that Québec is a total mess.
There are also 35 ridings where you may want to vote Liberal for consideration #2 (or, if you're a Conservative, to block the NDP or the Bloc). In the other 160 ridings, strategic voting is not recommended.
1. Vote to defeat the Conservative candidate at the riding level
In the 143 ridings listed below, the difference between the Conservative vote share and the top non-Conservative one is less than 15%.
- "Vote X" means that party X is 15% or more above all other non-Conservative options.
- "Wait if you can, otherwise vote X" means that party X is 5-15% above the next highest non-Conservative option. (Counted as "Vote X" in summary above)
- "Too close" means that the top two non-Conservative options are within 5% of each other. These options are listed in parentheses.
Vote Liberal (64)
BC (5): North Vancouver, Richmond Centre, South Surrey--White Rock, Vancouver South, West Vancouver--Sunshine Coast--Sea to Sky Country
AB (5): Calgary Centre, Calgary Confederation, Calgary Skyview, Edmonton Mill Woods, Fort McMurray--Cold Lake
MB (4): Charleswood--St. James--Assiniboia--Headingley, Saint Boniface--Saint Vital, Winnipeg South, Winnipeg South Centre
ON (41): Ajax, Aurora--Oak Ridges--Richmond Hill, Brampton South, Burlington, Cambridge, Don Valley East, Don Valley North, Don Valley West, Eglinton--Lawrence, Etobicoke Centre, Etobicoke--Lakeshore, Glengarry--Prescott--Russell, Haldimand--Norfolk, Kanata--Carleton, Kenora, King--Vaughan, Kitchener--Conestoga, London West, Markham--Stouffville, Markham--Unionville, Milton, Mississauga Centre, Mississauga East--Cooksville, Mississauga--Erin Mills, Mississauga--Lakeshore, Mississauga--Streetsville, Nepean, Newmarket--Aurora, Northumberland--Peterborough South, Oakville, Oakville North--Burlington, Orléans, Ottawa West--Nepean, Peterborough--Kawartha, Pickering--Uxbridge, Richmond Hill, Scarborough--Guildwood, Toronto--St. Paul's, Vaughan--Woodbridge, Willowdale, York Centre
QC (3): Lac-Saint-Louis, Mount Royal, Pierrefonds--Dollard
NB (2): Fredericton, Miramichi--Grand Lake
NS (2): Central Nova, Cumberland--Colchester
PE (1): Egmont
Nunavut
Wait if you can, otherwise vote Liberal (18)
BC (2): Delta, Steveston--Richmond East
ON (12): Bay of Quinte, Brampton Centre, Brampton East, Brampton North, Hamilton West--Ancaster--Dundas, London North Centre, Kitchener Centre, Kitchener South--Hespeler, Scarborough Centre, Scarborough--Rouge Park, St. Catharines, Waterloo
NB (2): New Brunswick Southwest, Saint John--Rothesay
NS (1): South Shore--St. Margarets
Yukon
Vote NDP (9)
BC (5): Cowichan--Malahat--Langford, Kootenay--Columbia, Nanaimo--Ladysmith, Port Moody--Coquitlam, South Okanagan--West Kootenay
AB (1): Edmonton Griesbach
SK (1): Desnethé--Missinippi--Churchill River
MB (1): Elmwood--Transcona
QC (1): Beauport--Limoilou
Wait if you can, otherwise vote NDP (25)
BC (8): Cariboo--Prince George, Coquitlam--Port Coquitlam, Courtenay--Alberni, Esquimalt--Saanich--Sooke, Kamloops--Thompson--Cariboo, Mission--Matsqui--Fraser Canyon, North Island--Powell River, Pitt Meadows--Maple Ridge
SK (5): Regina--Lewvan, Regina--Qu'Appelle, Saskatoon--Grasswood, Saskatoon--University, Saskatoon West
ON (4): Algoma--Manitoulin--Kapuskasing, Hamilton East--Stoney Creek, Niagara Centre, Oshawa
QC (7): Abitibi--Baie James--Nunavik--Eeyou, Argenteuil--La Petite Nation, Beloeil--Chambly, Charlesbourg--Haute-Saint-Charles, Portneuf--Jacques-Cartier, Québec, Vaudreuil--Soulanges
Northwest Territories
Attendez si vous le pouvez; sinon, votez Bloc (1)
Bécancour--Nicolet--Saurel
Too close (26)
BC (3): Burnaby North--Seymour (NDP/LIB), Fleetwood--Port Kells (NDP/LIB), Vancouver Granville (LIB/NDP)
AB (1): Edmonton Centre (LIB/NDP)
ON (5): Brantford--Brant (LIB/NDP), Essex (NDP/LIB), Sault Ste. Marie (LIB/NDP), Scarborough North (LIB/NDP), Scarborough Southwest (LIB/NDP)
QC (17): Alfred-Pellan (LIB/NDP), Avignon--La Mitis--Matane--Matapédia (BQ/LIB), Beauport--Côte-de-Beaupré--Île d'Orléans--Charlevoix (BQ/NDP), Berthier--Maskinongé (NDP/BQ), Brome--Missisquoi (LIB/NDP), Chicoutimi--Le Fjord (NDP/BQ), Gaspésie--Les Îles-de-la-Madeleine (BQ/LIB), Jonquière (NDP/BQ), Laurentides--Labelle (NDP/BQ), Laval--Les Îles (NDP/LIB), Louis-Hébert (NDP/LIB), Pontiac (NDP/LIB), Rimouski-Neigette--Témiscouata--Les Basques (NDP/BQ), Saint-Maurice--Champlain (NDP/BQ), Salaberry--Suroît (NDP/BQ), Sherbrooke (NDP/BQ), Vimy (NDP/LIB)
2. Vote for the party most likely to beat the Conservative seat count
This party is currently the Liberal party. The 35 races below are ones where: i) the Tories are not competitive, and ii) the difference between the Liberal vote share and the top non-Liberal one is less than 15%. In all cases, you would help defeat the NDP; in Québec, you would also help defeat the Bloc in the starred (*) ridings.
BC (2): Surrey Centre, Victoria
MB (1): Churchill--Keewatinook Aski
ON (11): Beaches--East York, Ottawa Centre, Parkdale--High Park, Spadina--Fort York, Sudbury, Thunder Bay--Rainy River, Thunder Bay--Superior North, Timmins--James Bay, Toronto Centre, University--Rosedale, York South--Weston
QC (18): Ahuntsic-Cartierville, Châteauguay--Lacolle*, Compton--Stanstead*, Dorval--Lachine--LaSalle, Hochelaga*, Hull--Aylmer, La Pointe-de-l'Île*, LaSalle--Émard--Verdun*, La Prairie, Laurier--Sainte-Marie*, Longueuil--Charles-LeMoyne*, Marc-Aurèle-Fortin, Montarville*, Outremont, Papineau, Pierre-Boucher--Les Patriotes--Verchères*, Rivière-des-Mille-Îles*, Ville-Marie--Le Sud-Ouest--Île-des-Soeurs
NS (2): Halifax, Sackville--Preston--Chezzetcook
NL (1): St. John's South--Mount Pearl
All right, that's all the fun for now. Are you ready for Super Friday? FIVE national polls are due: Léger, Mainstreet and Nanos in the morning, Innovative at some point, and EKOS in the afternoon. (In fact, the Léger national and Québec numbers are already out: like most polls in the past few days, it's good news for the Liberals.)
Subscribe to:
Posts (Atom)