Latest national poll median date: October 20
Projections reflect recent polling graciously made publicly available by pollsters and media organizations. I am not a pollster, and derive no income from this blog.
Showing posts with label Projection Trends. Show all posts

Sunday, October 20, 2019

Trends 2019: Seventh and Final Instalment

For new readers: these trends are different - and I would say more meaningful - than the ones you might see elsewhere, since they are retroactively recomputed* when old data becomes available. Thus, my "Trends" posts avoid showing "fake" variations caused by polls coming out with different lags. More details were provided in the first instalment of this series. My post on comparing models highlights other advantages of my approach.

As I work on my final projection (considering adjustments based on some sub-regional breakdowns from Campaign Research and IRG), here is the final trends post. As usual, all numbers in this post reflect my turnout adjustment of CON +1.5, LIB +0.5, NDP -1, GRN -1.


Methodological note: The data points for September 26, October 3 and October 11 are not plotted: each of those dates was the midpoint of only one public national poll (Nanos tracker), making those projections less reliable given that discounting has become very aggressive.

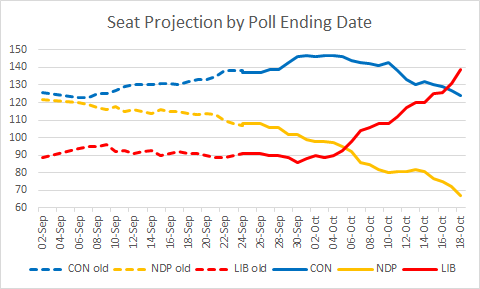
1. The major story of the final week of the campaign was a steep further rise of the NDP, peaking at 40 seats and 19% national support on Monday/Tuesday, followed by an equally steep pull back, to 31-32 seats and under 17% on Friday/Saturday. However, the final NDP number is back up to the mid-30s and 18.2%: the last two polls (by median date) showed the NDP either not dropping from its mid-week levels (Mainstreet) or actually surging on the final day (Nanos). If the momentum that Nanos picked up is real and continues on Election Day, the NDP could approach, or even surpass its 2015 seat count of 44. However, if the final polls just happened to see noise on Sunday and a few tight races don't go the NDP's way, it could easily end up in the 20s.

Either way, it'd be a much better result than envisaged at the start of the campaign, when the NDP was hovering around 15 seats. Will Jagmeet Singh continue to perform well once the election is over, or will he prove as ineffective as he was before the campaign?

2. The Liberals appeared to have turned things around at Thanksgiving. They hit rock bottom a day or two before Thanksgiving, and have been on an upward creep since, except for the final day polls. Were strategic considerations making their way into voters' minds? If the final day downtick was noise and/or their turnout matches the Tories', the Liberals should eke out a win. If both are true, they should win comfortably. And if in addition, the IVR pollsters are right about Ontario so that the Liberals win it by ~10 points instead of 5, they may start thinking about a majority. If, on the other hand, the Tories beat the polls significantly like in 2011, the NDP gains more Liberal voters, and the Bloc's supporters, who tend to be older, turn out in droves - i.e. the perfect storm against Liberals - the Grits could fall dangerously close to 100.

If the Liberals win the most seats, it will probably be because some soft voters, having not seen any other plausible option (those in ON possibly being turned off the Tories by Doug Ford), reluctantly came home. Given the country's relatively good economic performance in the past few years, it seems likely that Trudeau has been a net drag on his party's fortunes this year.

3. The Tories fell through Thanksgiving weekend, though there appears to have been a modest recovery in the last few days. The general trend of the past month has been ugly for them. One cannot help but feel that, with just an average-quality leader, the Tories would have capitalized on Trudeau's baggage and be on their way to at least a strong minority - strong enough that Trudeau would probably feel obliged to resign. Indeed, that would be the case if the Tories just held their constant August level of 36%. Unlike for the Liberals, it is hard to see the Tories getting a majority because they are so far behind in QC. Even if they somehow tie the Liberals in both ON and Atlantic Canada and get above 20 seats in BC, they'd probably still need 20 seats in QC, which is just not happening. On the other hand, it is not difficult to imagine the Tories failing to make substantial gains: one just needs the IVR pollsters to be right in ON and the Tories dropping some tight races in the Atlantic and BC.

4. The Bloc's explosive rise appeared to stop just before Thanksgiving, and its support has held steady this week. It's looking like a seat count in the 30s for them if the tossups don't all fall one way or another. The main risk for the Bloc is that a significant fraction of its supporters actually approve of the Liberal government. If these voters decide to "play it safe" after all, the Liberals could hold up surprisingly well and avoid significant losses in QC, which would limit the Bloc to picking up NDP seats and getting in the 20s. On the other hand, Quebecers like to jump on bandwagons; if the Bloc capitalizes on that, it could well crack 40.

5. As I've commented in every (or almost every) trends post since the first one in late August, the Greens are on a downward track. Last week, I ventured that the Greens could fall below their 2008 popular vote of 6.78%, and it looks like that will be really close. At this point, it's all about saving Nanaimo--Ladysmith for them - gains are still possible, but they would be gravy. Just like Trudeau and Scheer, May needs to go.


*Changes made on or after Sept. 25 are only reflected back to the start of the campaign (Sept. 11). These include the re-weighting of standalone regional polls (i.e. regional numbers not part of a national poll), the Guilbeault baseline adjustment in Laurier--Sainte-Marie and fixing an old spreadsheet error. These only make a barely visible (if at all) difference on the graphs.

Sunday, October 13, 2019

Trends 2019: Sixth Instalment

For new readers: these trends are different - and I would say more meaningful - than the ones you might see elsewhere, since they are retroactively recomputed* when old data becomes available. Thus, my "Trends" posts avoid showing "fake" variations caused by polls coming out with different lags. More details were provided in the first instalment of this series. My post on comparing models highlights other advantages of my approach.

By now, you've probably heard that the Liberals have essentially lost their seat edge. How did we get here? It's time for another trends post! As usual, all numbers in this post reflect my turnout adjustment of CON +1.5, LIB +0.5, NDP -1, GRN -1.


Methodological note: The data points for September 26 and October 3 are not plotted: each of those dates was the midpoint of only one public poll (Nanos tracker), making those projections less reliable given that discounting has become very aggressive. October 11 would also fall into this category, but I've plotted it since it's the last date available.

1. Both the Liberals and the Conservatives have lost over 3 points from their campaign highs, which occurred just before "blackface" for the Grits and just after it for the Tories.
- For the Conservatives, the fall happened in three phases: coming off the immediate post-blackface high, Andrew Scheer's rough week with resume-gate and dual-citizenship-hypocrisy-gate, and then the debates.
- For the Liberals, "blackface" cost about 1.5 points on impact, but the Scheer pre-debate struggles helped them recover a good chunk of the lost ground. However, Jagmeet Singh's good performance in Monday's English language debate proved even more costly than "blackface" for the Liberals: around 2 points and 20 seats lost, essentially overnight.
- For both parties, the situation may be stabilizing, but the truth is that after an avalanche of polls with an Oct. 9 midpoint date, there were few with an Oct. 10 or Oct. 11 one. So the stabilization you see on the graphs is very preliminary, and may be a mirage.

2. The NDP had been creeping up throughout the campaign, but was mostly just regaining the ground lost during its disastrous pre-writ period. What has happened since the English debate, however, is another story: an impressive 3-point jump essentially overnight, drawing from both the Liberals and Tories.
- As many have mentioned, trends starting at this point in the campaign just amplified in the final week in 2011 and 2015. However, there is a crucial difference from 2011 and 2015: back then, the party heading up (NDP in 2011, Liberals in 2015) gained a lead over their main competitor, so strategic voting may have taken care of the rest. This time, the NDP remains well behind the Liberals, so strategic considerations would act in the opposite direction in most of ON, QC and parts of other provinces. This makes the trajectory of the final week very unpredictable.

3. The BQ's trend has been quite similar to the NDP's, and the seat projections for them have been essentially identical for the past 3 weeks.
- In the BQ's case, there is no strategic consideration that would cause its recently acquired supporters to turn away in the final week. Therefore, I would rate the odds of a significant pull back to be lower for the BQ than the NDP. However, the BQ is in a zone where its seat projection is very sensitive to its vote share, so even a minor pullback could push it back well below 30 seats.

4. If you have been following my "Trends" posts, you've probably noticed that I have consistently been bearish on the Greens, who keep heading down except during major external events (NDP pre-writ losses, "blackface," Greta's protests). Well, the past week has done nothing to change that: despite the big Liberal drop, the Greens are flat, possibly with any gains offset by losses to the NDP. Worse, the NDP is the Greens' main competitor in their Vancouver Island targets. Perhaps there will be some local effect that allows the Greens to nevertheless make several gains on the Island, but both the Esquimalt--Saanich--Sooke seat poll by Mainstreet and the September sub-BC breakdown by Insights West suggest nothing of the sort. The Greens are even at risk of falling short of their 2008 vote share!

There will be a final trends post next weekend, and possibly one mid-week if developments warrant it. Buckle up - this could be a wild ride!


*Changes made on or after Sept. 25 are only reflected back to the start of the campaign (Sept. 11). These include the re-weighting of standalone regional polls (i.e. regional numbers not part of a national poll), the Guilbeault baseline adjustment in Laurier--Sainte-Marie and fixing an old spreadsheet error. These only make a barely visible (if at all) difference on the graphs.

Monday, October 7, 2019

Trends 2019: Fifth Instalment

For new readers: these trends are different - and I would say more meaningful - than the ones you might see elsewhere, since they are retroactively recomputed* when old data becomes available. Thus, my "Trends" posts avoid showing "fake" variations caused by polls coming out with different lags. More details were provided in the first instalment of this series. My post on comparing models highlights other advantages of my approach.

Where did we stand before the English debate, and what appears to be the early impact of the TVA debate? It's time for another trends post! As usual, all numbers in this post reflect my turnout adjustment of CON +1.5, LIB +0.5, NDP -1, GRN -1.


Methodological note: The data points for September 26 and October 3 are not plotted: each of those dates was the midpoint of only one public poll (Nanos tracker), making those projections less reliable given that discounting has become very aggressive.

- The most consequential thing to note is that the Tories appear to have lost some ground. After being consistently between 36% and 37% for months, they have now slipped to around 35%. Of course, the magnitude of the change is small, and it may be reversed in the coming days. However, Andrew Scheer must be hoping that this is not the start of a new trend that sees Conservative support reach its 2015 levels outside Atlantic Canada (when it was abnormally low) and the Prairies (where more Tory votes don't bring many seats).

- The Liberals have not recovered all the ground lost in the wake of "blackface," but they are back to their consistent August level of around 34%. Thanks to the Tories' small fall, the popular vote gap has shrunk to its lowest level. In fact, without the turnout adjustment, the Liberals are marginally ahead of the Tories.

- The NDP has been slowly but steadily gaining ground since the start of the campaign, and is now exceeding its August level in popular support. Will Jagmeet Singh's performance at the debate further the momentum? Or will the NDP start suffering from strategic voting as Election Day nears?

- The Bloc has also gained ground, though the gains have not been steady as the NDP's. The TVA debate seems to have helped the Bloc achieve further gains, although the size of those gains remains unclear.

- The NDP and Bloc gaining a combined 15-20 seats has increased the odds of a minority government, though a majority remains very much within reach, especially for the Liberals.

- The Greens are on a long-running gentle downward trend. Three events broke that trend: the NDP's decline in the late August, "blackface," and the climate march. However, after each of these, the Greens fell back to the almost straight line downward track that has prevailed since late July.


Now my two cents on the debate:

- Singh had a good first half of the debate, with several zingers, the most memorable of which were about the Liberal government dragging indigenous children to court while trying to spare SNC Lavalin, and about Mr. Deny vs. Mr. Delay. Much like in the Maclean's debate, Singh faded in the second half of the debate, but the first impression is often what matters. Moreover, Singh remained very human and personable all the way through. If strategic voting does not occur - a HUGE if - Singh has probably done enough to maintain the NDP's positive trend.

- Scheer was likely way too aggressive in his first answer, not at all addressing the question (as pointed out by May, who followed him) and immediately going off topic and attacking Trudeau. After that, he seemed to have a mostly neutral performance - certainly much better than the one he put in at the TVA debate last week. Moreover, Bernier was very ineffective - even inexplicably forgetting to mention supply management during the affordability segment - so it does not look likely that the Tories would bleed much support to the PPC. Overall, this may have been enough to nip the Tory negative trend in the bud, if only because it changes the channel away from a rough week for the Conservative campaign.

- May had a fairly typical performance. She came off as idealistic, both in a good and a bad way. She kept hammering on the carbon reduction target, but voters wanting to learn more about the Green plan to assess its content were probably left on their appetite. Singh's good performance is also a problem for May.

- Trudeau did not fare terribly, but this was not his best night. His inability to respond to some of Singh's attacks because it wasn't his turn to talk may hurt him. Going after Singh for refusing to intervene in the Bill 21 court case may come back to bite him in QC. His line about getting 3/4 of the way to the GHG emissions target was not only misleading (like many claims by other leaders), but also non-credible. This may blunt the effectiveness of his obvious attempt to rally left-of-centre voters around him over the issue of climate change. On the other hand, the general cacophony of the debate would likely limit any damage, and the left-of-centre vote may yet consolidate around the Liberals when the dust settles and minds focus.

- Blanchet's criticism of the Canadian government for arresting Meng Wanzhou was interesting. Otherwise, he often spoke too slowly given the limited time, and probably did not come off as sympathetic as Duceppe did in some previous English-language debates.


*Changes made on or after Sept. 25 are only reflected back to the start of the campaign (Sept. 11). These include the re-weighting of standalone regional polls (i.e. regional numbers not part of a national poll), the Guilbeault baseline adjustment in Laurier--Sainte-Marie and fixing an old spreadsheet error. These only make a barely visible (if at all) difference on the graphs.

Sunday, September 29, 2019

Trends 2019: Fourth Instalment

For new readers: these trends are different - and I would say more meaningful - than the ones you might see elsewhere, since they are retroactively recomputed* when old data becomes available. Thus, my "Trends" posts avoid showing "fake" variations caused by polls coming out with different lags. More details were provided in the first instalment of this series. My post on comparing models highlights other advantages of my approach.

What was the effect of "blackface," and what has happened to voting intentions in its aftermath? It's time for another trends post! As usual, all numbers in this post reflect my turnout adjustment of CON +1.5, LIB +0.5, NDP -1, GRN -1.


We finally see some movement!

- The Liberals lost 1.5-2 points in the immediate aftermath of "blackface." A modest recovery has occurred, but they are still about 1 point short of where they were before the revelations.

- Right after "blackface," the Tories saw a modest rise in popular support - so small that it might have been just noise. Nevertheless, the Liberal fall helped them briefly gain a tiny seat lead (though this would not have happened without the turnout adjustment). Conservative gains, whether real or due to statistical noise, have been entirely erased, and Scheer's party is now at its lowest popular vote support (and near its lowest seat projection) since my projections started.

- The Liberal seat lead in the past 3 days has hovered around 10. That is tiny: with these numbers, the Tories would have a 40% chance of winning the most seats in an election today. For the actual election, it's almost 50:50.

- The NDP has been steadily regaining the ground lost during the pre-writs period, and the recovery is now almost complete.

- Despite the NDP's gains, it has marginally fallen into fourth place in the seat projection due to the Bloc's abrupt rise post-"blackface."

- Both the NDP and the Bloc have extremely few safe seats, so despite them flirting with the 20-seat bar in the projection, they are both still in danger of not reaching the requisite 12 for official party status.

- The Greens gain when there are external events: NDP's pre-writs struggles, "blackface" and the climate strike. However, the intervening drops mean that they are still below their July levels.

Quite remarkably, comparing the latest numbers to the August 11 ones, we see that all four national parties are down marginally both in seats and in popular support - only the Bloc is up. This is a sign that Canadians are not drawn to any of the choices, and greater numbers of those that have the option of a palatable and meaningful protest vote (Quebecers) are choosing it.

Why is this happening? As I have commented on Twitter, I believe that all four parties' platforms are inferior to current policy; in other words, they're all proposing to make the country worse. More relevant for most voters, however, is the fact that all four leaders have shown serious shortcomings:

- Trudeau's ethical lapses are well-known, and the "blackface" revelations are yet another reminder of his lack of judgment. He appears to have no vision for the country, being simply on a mission to simultaneously outbid the Tories on financial goodies and pay at least lip service to all of the NDP's priorities.

- Scheer is entirely uninspiring (bringing back ineffective Harper-era policies), tone-deaf on climate (building highways helps reduce emissions?!), and lies about his own work experience (as well as basic arithmetic). His response to the "blackface" episode - immediately going to "racist" and "unfit to be Prime Minister" - reinforced his sophomoric image.

- Singh has shown himself time and time again before the campaign to not know the issues and not have the organizational skills to lead a party. However, he has performed better during the campaign (notwithstanding that some of his announcements were squarely within provincial jurisdiction), which may explain the NDP's recovery.

- May continues to show poor judgment (recall her ill-fated attempt to distinguish between "separatist" and "sovereigntist"), and the Green Party's platform costing turned out to be completely amateurish, exposing the party as wholly unprepared to govern - and perhaps even to be a serious partner for a minority government.

So, um, yeah. Normally, as an economist, I want people to think more about the issues. But this time, the choice is so depressing that we might as well all sit back and go fully into "political junkie" mode, the future of the country be damned.


*Changes made on or after Sept. 25 are only reflected back to the start of the campaign (Sept. 11). These include the re-weighting of standalone regional polls (i.e. regional numbers not part of a national poll) and the Guilbeault baseline adjustment in Laurier--Sainte-Marie. These only make a barely visible (if at all) difference on the graphs.

Thursday, September 19, 2019

Trends 2019: Third Instalment

For new readers: these trends are different - and I would say more meaningful - than the ones you might see elsewhere, since they are retroactively recomputed* when old data becomes available. Thus, my "Trends" posts avoid showing "fake" variations caused by polls coming out with different lags. More details were provided in the first instalment of this series.

Now seems like a good time to take stock of how the campaign was going, before a completely new trend *might* possibly develop. As usual, all numbers in this post reflect my turnout adjustment of CON +1.5, LIB +0.5, NDP -1, GRN -1.


For the main parties, the takeaways are quite boring:

- The Conservatives have been between 35.8% and 36.8% for the entire time. One might think that this could be due to the poll averaging formula putting high weight on old data, but that is far from the case. For example, polls conducted since the campaign started currently have a weight of 97.7% for the national average. The observed variations are well within what a normal amount of random noise can generate with a perfectly flat trend. The seat trend is almost equally unexciting, having been within 3 seats of 145 since July 29.

- The Liberals have also been relatively flat, except for a step up from around 34% to 34.5-35% in late August, when they brought out same-sex marriage and abortion. (The step occurs at the inclusion of a Léger and an EKOS poll, and sticked despite those polls now combining for marginally negative weight in the average.) The seat projection shows a similar step up, from around 155 seats through most of August to around 160 seats in the past 3 weeks. Of course, this step is very small, and only noticeable because so little else has been going on.

Things get more interesting for the smaller parties:

- The NDP went through a very rough period in late August and early September, dropping from 13% to around 11.5%, and from around 20 seats to around 15. In the past week, however, it has stopped the bleeding, right around the threshold of 12 for official party status - the model says just above, but it could well be just below as the remaining NDP ridings are rather atypical and may not move in accordance with provincial swing.

- As I've pointed out in earlier posts, the Greens were on a gentle slide through most of August. They may have partially recovered during the NDP drop, but now that the NDP appears to have steadied itself, the Greens seem to be sliding again. The first week of the campaign has not been kind to Elizabeth May, who positioned herself far to the left at the Maclean's debate (at odds with her campaign slogan), and then with the "separatist" vs. "sovereigntist" argument making her sound rather ridiculous.

- The Bloc appears to have gained some ground vote-wise, but the seat trend has kept bouncing around 10-12. The reason is that the Liberals, their main rivals, have also been gaining ground in QC. (In fact, if I were to look at regional trends, I'd probably find that the aforementioned Liberal step up basically happened in QC.)

Are these trends about to shift dramatically? We'll get a better idea over the next few days, when pollsters will probably be very active.

I end by pointing out that if these trends are more stable than those you might see elsewhere, it might be because (in addition to the recomputations) my poll weighting method attempts to minimize variations due to changes in pollster composition: because pollsters are in the field at different times, their relative weights shift in the average, which can cause spurious variations. One example of how this helps is that in today's projection updates, both 338Canada and the CBC Poll Tracker showed the Liberal seat lead shrinking by 14-15, while mine showed a change of just 5, despite actually weighting recent polls more heavily than the CBC Poll Tracker. This happened (at least partly) because my model assigned negative weight to old Angus Reid polls after the new one came out - and Angus Reid consistently produces poor numbers for the Liberals.

*I did not recompute projections before Aug. 28 to account for the revision in the Lac-Saint-Jean baseline adjustment because the net effect is under 0.1 seats for all parties, and polling averages are unaffected.

Wednesday, September 11, 2019

Trends 2019: Second Instalment

Update Sept. 12: Extended the trend lines to include the Sept. 11 Forum poll.
Update Sept. 13: Modified the extension to include the Sept. 11 DART poll.

The writs have been issued! Now is a good time to take a look back at the pre-campaign period, especially since we got many older pieces of data in the past few days, such as Nanos 4-week polls, two EKOS July regional breakdowns, a MQO NS poll, etc.

For new readers: these trends are different - and I would say more meaningful - than the ones you might see elsewhere, since they are retroactively recomputed when old data becomes available. Thus, my "Trends" posts avoid showing "fake" variations caused by polls coming out with different lags. More details were provided in the first instalment of this series.


Here are my takeaways:

- The Conservatives have basically not moved at all since late July. At all 13 14 points at which a polling average was computed, they got between 35.9% and 36.7 37.0 36.7%. This is quite striking, as the sample has effectively been renewed 1.5 times. Accordingly, their seat count has consistently been around 145. What looked like a late-August drop in the previous "Trends" post proved to be a blip. It will be interesting to see if the latest bump also ends up being a blip. Well, it didn't take long for the DART poll to mostly eliminate the bump.

- The Liberals have been on an upward trend, gaining almost 2 about 1.5 points since late July. Adding the older data did not affect the conclusion that the Dion report had no apparent impact on Liberal support - it came smack in the middle of the period of Liberal stability in the first 3-4 weeks of August. The size of the Liberal gains in the past two weeks is uncertain, especially in terms of seats: as you can see, the projection has become less stable recently due to some pollster disagreements.

- The NDP was pretty flat during most of August: around 20 seats and 12-13%. However, it has dropped rather quickly in the past two weeks, which probably explains the steeper Liberal increase during this time. Will it be able to recover? And remember that things might actually be much worse than what the model is showing.

- The Bloc's trend is interesting. The previous instalment showed the Bloc gaining, but as it turns out, adding the retroactive data erased most of that trend - it probably wasn't real. What remained of it was wiped out by the latest Mainstreet poll, so the Bloc is back where it was in late July - around 10 seats.

- Finally, the Green trends are interesting too: as the previous instalment showed, it had been on a gentle month-long slide in August. In terms of voting intentions, that appears to have stopped in the past two weeks, and the party may even have regained some of the lost ground; this could be thanks to the NDP's struggles. However, while the seat projection has continued to drop stopped dropping, it has not turned up either, as the Greens' numbers in BC and Atlantic Canada, their most promising regions, continue to be unimpressive.

This will be an exciting campaign for many reasons. Just focusing on seats and vote shares:

1. Things are very tight between the top two parties. A 20-seat swing between them corresponds to only about a 2-point swing, which is well within the range of aggregate polling errors and potential turnout effects. Thus, even if the election were today, the outcome would be highly uncertain. And as we've seen many times, the Canadian electorate can be extremely volatile.

2. The Liberals appear to have a large map advantage: they have been consistently behind in the vote projection, but ahead in the seat projection. We may end up with a split outcome, and there's even a small chance of a Liberal majority while the Tories win the vote count. This (majority while losing vote count) has happened only once in a Canadian federal election, and it was in 1896.

3. There are two races for third place: NDP/BQ for seats, and NDP/GRN for vote share.

4. The NDP and the BQ happen to be right around the crucial 12-seat threshold for official party status. Moreover, neither of them has many very safe seats, so a near wipeout is a real possibility for both (the BQ has already experienced that in 2011).

So buckle up, and follow along!

Saturday, August 31, 2019

Trends 2019: First Instalment

Update Sept. 1: The trends now reflect the EKOS poll released Sept. 1, which has the same field dates as the Léger poll released Aug. 31.

Below are the projection trends since the first projection issued in early August. The plots show how the projection would have evolved with the current model, had the polls been released in the order in which they were conducted. This means that the seat counts are recalculated when an older poll is published after a newer one, or when I tweak the methodology. The result is not quite the same as the retroactive best guess at what the situation was at the time (since I don't use the subsequent data to "backcast" how things were), but it's closer than just plotting projections as they're issued, as most other sites do.

Details for how these trends were generated are given at the end of the post.


The trends show the following evolution in late July and August:

- The CONs lost their seat lead in late July, and were remarkably flat around 145 seats and 36% support during most of August. The latest EKOS ON numbers and Léger national polls, however, ended this period of stability. It will be interesting to see whether this sticks, like the drop in late July.

- The LIBs have generally been in the 33-34% range and in the low-to-mid 150s in terms of seats. The Dion report had no discernible effect. The latest EKOS ON numbers and Léger polls pushed them above 34% and to nearly 160 seats for the first time. Again, it will be interesting to see if this rise is confirmed or is just a blip.

- The NDP has been flat around 20 seats and 13% support. But don't let the flat trend fool you: there is wide disagreement among pollsters regarding where the NDP is. Update: Also, although the monthly trend is flat, it will be interesting to see if the drop in the past two weeks continues.

- The BQ has quietly made some gains, passing the critical threshold of 12 seats. However, whether it would, in fact, win 12 or more seats remains essentially a coin flip. Many BQ races, both projected wins and losses, are very tight, so the uncertainty is very large relative to the seat count.

- The GRNs have been quietly fading in terms of vote share, for example falling to fourth place in BC. Remember that in 2015, the NDP was riding high during the summer thanks in part to Rachel Notley's win in AB, only to be sorely disappointed in the fall. Does the same fate await the Greens after encouraging results in recent provincial elections? Or do they manage to leverage Elizabeth May's popularity and eat into the Liberal/NDP vote, thereby earning the balance of power (or causing a Conservative majority)?

Going forward, I plan to update trends every week or two.

Here are some methodological details for these trends:
- The dates correspond to the midpoint of the most recent poll in the projection. Polls with midpoint dates within a day or two may be grouped. For example, there are Abacus and DART polls with a midpoint date of Aug. 16.5, and Léger and Ipsos polls with a midpoint date of Aug. 17.5. All of them are first included at the Aug. 17 point.
- Methodological updates (e.g. change in turnout adjustment) and adjustments to ridings identified as special cases lead to recalculations (even if those adjustments informed by subsequent polls, as long as those polls likely mainly reflect things baked in before the first projection). Poll-based adjustments to other ridings or to sub-regions do not lead to recalculations, as they may reflect actual evolution of the situation.
- Regional, sub-regional and riding-level polls are included in the numbers at the same time as the nearest national poll (except, as mentioned above, for certain polls in special-case ridings). For example, the Corbett ON poll with a midpoint date of August 12 begins to be included at the August 11 point, as the nearest subsequent national poll has a midpoint date of August 16.5.

Sunday, October 18, 2015

Final Projection Trends

Before I figure out how to deal with the issues raised in the previous post for the final projection, I present the last update of projection trends. I'm doing this before the final projection since trends are most informative when computed with a consistent methodology.


For those of you that are new, the dotted lines indicate that those projections were made without taking into account riding polls and sub-regional breakdowns.

As you can see, in the past 2 weeks, the Liberals have gained seats at a fairly consistent rate of 3-4 seats per day. The Tories have been losing 1-2 seats per day, also fairly consistently. The NDP, however, has had two periods of steep drops with an interlude in between: for a while, it appeared as though the NDP stopped the bleeding at around 80 seats, but the down trend then resumed with a vengeance.


The vote shares tell a similar story, though the Tories have lost only 2 points in the past 2 weeks. The Liberal surge, especially in Ontario, hurt the Conservatives more than the drop in their own support (i.e. if it were instead the NDP that had gained support, the Tories would not have lost as many seats). More remarkable is the fact that the NDP has lost over 1/3 of its support since Labour Day.

Finally, I should also mention that the Greens have lost roughly 1 point in the past 2 weeks, probably as progressive voters switched in order to "make their vote count." This is why Elizabeth May pleaded for people to vote their conscience.

Thursday, October 15, 2015

Weekly Trends: Tories Slide, Liberals Climb, NDP Levels Off

Here are the weekly trends (a day early, since I'll post the final trends in 3 days anyway).


(In case you're new to this blog, the dotted lines refer to projections that did not take riding polls and sub-regional breakdowns into account.)

After flirting with the 150-seat level in the first few days of October, the Tories started pulling back last week, and their decline accelerated this week. Meanwhile, the Liberals have continued their steep ascent. Note that the only polls ending on Oct. 13 and 14 are the rolling EKOS and Nanos polls, so it is too early to say that the Conservative fall and/or the Liberal rise have stopped.

The NDP, however, has been essentially flat for five days, so it appears that it has settled around 80 seats. In Québec, the NDP stopped its slide just before disaster: with a current poll average just under 30%, it still stands to win roughly half of the seats in Québec. However, Quebecers may not have said their last word yet.

The vote share trends (adjusted for turnout) tell a similar story, but the Liberals have been ahead for a few days:


It's interesting to note that despite being about 6 full points lower than where the Liberals were during most of September, the NDP is only about 10 seats lower. This is almost entirely due to Québec: elsewhere in the country, the NDP is projected to win only 40 seats, about the same (especially if you consider that the total number of seats has increased) as it did in 2008, before the orange wave. Thus, outside Québec, the NDP is almost down to its base; in Québec, is 28-30% its new base? We may find out in the negative in the next few days; if not, we likely won't find out before the next election...

Friday, October 9, 2015

Week in Review: Liberal Surge

(Note: For those of you interested in strategic voting (polls suggest ~30% of you are), see my guide for the advanced polls. It was written Thursday night, and does not take into account polls released subsequently.)

(Update late 10/9: Angus Reid 10/7-9 poll)

Late last week, the Conservatives appeared to be running away with the election. Now, the Liberals are duking it out with the Tories for the popular vote lead, and if the current trends continue, by the end of next week, they will be fighting for the seat count lead. However, if the NDP is approaching its floor in Ontario, the next 20 seats may be tougher for the Liberals to gain than the 20 it gained this week.

First, a summary of the latest national numbers from the 9 pollsters in the field this past week:

L-C-N
32-33-26 (Ipsos, 10/2-4)
32-33-24 (Abacus, 10/5-6)
35-31-26 (Forum, 10/5-6)
34-30-25 (Léger, 10/5-7)
35-36-20 (Mainstreet, 10/6-7)
35-30-24 (Innovative, 10/5-8)
34-31-25 (Nanos, 10/6-8)
33.8-33.7-20.4 (EKOS, 10/6-8)
31-33-25 (Angus Reid, 10/7-9)

The Liberal vote share ranges from 31% to 35%. However, the 32% results occurred early in the week, and the five of the six most recent polls are within a very narrow range of 33.8% to 35%, with Angus Reid being the outlier at 31%. The last unadjusted projection (issued before Angus Reid) pegged the Liberals at 33.1%, meaning that if their late-week numbers are sustained, the Liberals will keep gaining in the projection.

The Conservative vote share ranges from 30% to 33.7%, with Mainstreet putting it at 36%. The last unadjusted projection placed it at 32.6%. It looks like the Conservative vote is quite stable at this point.

The NDP vote share ranges from 24% to 26% in six polls, while Mainstreet and EKOS peg it at 20%. The last unadjusted NDP poll average was 23.9%. It will be interesting to see if its slide has stopped, as the Nanos tracking suggests, or if it is still ongoing, as the EKOS tracking suggests.

The adjusted vote share, which includes a turnout adjustment where Conservative supporters are roughly 10% more likely to vote than other electors, still favours the Tories, but the gap has shrunk in a hurry:


A week ago, the Conservative lead of 5.5 points was at its widest of the campaign. Now, this lead is down to 2.1 points, a decrease of 62%. (Without the turnout adjustment, the lead has been completely wiped out, and the Liberals are marginally ahead.)

We can see that during almost all of September, NDP losses appeared to go to the Tories. Most likely some of it actually went to the Liberals, who probably lost some centre-right voters to the Conservatives. However, in the past 7 days, the Liberals gained 3.4 points thanks to a 2.7-point drop in NDP support (and a 0.6-point drop in Green support). The most obvious explanation - and likely the right one, though we can only speculate - is that these were "change" electors deciding that Trudeau is more likely than Mulcair to replace Harper.

All this of course has an impact on the seat projection:


The dotted lines refer to projections made before the inclusion of riding polls and sub-regional breakdowns.

The NDP is now lower than the Liberals have ever been in the past month. The Conservatives have come off their highs due to Liberal strength in Ontario, and their chances of a majority have roughly halved, from about 10% to about 5%. The Liberal chances of winning have increased roughly five-fold, from 2-3% to 10-15%. (All these probabilities are if the election had taken place mid-week last week or this week - the uncertainty for actual election day is of course greater.)

I will write a post in the coming week about where these probability estimates come from. I believe that some of the other ones out there overstate the precision of seat projections, but The Globe's Election Forecast gets reasonable results (it shows a higher Liberal probability of winning because it does not include a turnout adjustment).

Below is a brief region-by-region overview:

- Atlantic: The Liberal vote share is roughly double the (very similar) NDP and Conservative support levels. It is difficult to know how things are distributed by province, but whatever happens, the Liberals should win 20-27 out of 32 seats here.

- Québec: A complete mess. The Bloc usually has problems with turnout, so it will have trouble coming out on top of this four-way race. The NDP probably still has a small edge over the Liberals, but don't be surprised if it goes away completely. The wild card is the Tories: are they at 17-23%, as phone/online polls suggest, or 23-27% as IVR polls suggest? Commentator Jean Lapierre believes that some Conservative supporters in Québec feel ashamed to admit that they will vote Tory, so perhaps the IVR polls are more correct. My adjusted average currently shows NDP 29%, LIB 25%, CON 24%, BQ 19%.

No regional breakdown has been offered in Québec for several weeks. However, Jean-Marc Léger says that the NDP is 2nd everywhere: in Montréal to the Liberals, in Quebec City to the Tories, and in the countryside to the Bloc. If that is borne out, the current NDP projected seat count of 41 would be a gross overestimate, and the Bloc might regain official party status.

- Ontario: The polls this week show:

L-C-N
38-35-24 (Ipsos, 10/2-4)
39-34.8-22.5 (Nanos, 10/3-5)
39.2-38-16.8 (EKOS, 10/3-5)
39-32-23 (Abacus, 10/5-6)
38-35-23 (Forum, 10/5-6)
37-34-24 (Léger, 10/5-7)
44-37-14 (Mainstreet, 10/6-7)
43-31-21 (Innovative, 10/5-8)
41.1-33.7-21.7 (Nanos, 10/6-8)
38.5-36.3-17 (EKOS, 10/6-8)
36-36-22 (Angus Reid, 10/7-9)

Unanimous agreement: if everyone turns out, Ontario is currently red. (Well, Angus Reid shows a tie, but Angus Reid has been low on the Liberals in ON throughout the campaign.) The Liberals were at 37-39% early in the week. Have they increased to the low 40s? This is THE question for the next few days. If so, they have a real chance of winning the election. But if they remain in the high 30s, it probably won't be enough. My adjusted average is currently skeptical, showing LIB 38%, CON 37%, NDP 20%. Look for a continued Liberal surge in the projection if today's Mainstreet, Innovative and Nanos numbers hold.

- MB/SK: Roughly speaking, these are to the Tories what the Atlantic provinces are to the Liberals. The bulk of tight races are Conservative/NDP ones in Regina and Saskatoon. The Liberals should get a healthy delegation from Winnipeg.

- AB: The NDP has dropped dramatically here, from 25-30% in late August to around 15% now. Proportionally, this is as dramatic a decline as it suffered in Québec! Some of the vote went back to the Tories, while some went to the Liberals, who are now above 20% in most polls. The current projection probably overestimates the Conservative seat count here: there's noise from insider pollsters that the Liberals are, in fact, poised to make gains, but there are no publicly available hard numbers showing that. Riding polls in the last week of the campaign may provide some clarity.

- BC: It's a three-way tie in the unadjusted numbers here, giving the Tories a marginal lead in the adjusted average: CON 32%, NDP 29%, LIB 29%. The Liberal vote is inefficient to the extreme here: it is very concentrated in a small number of ridings, which leaves most other ridings around 20-25%, not enough to win. As a result, the Liberals are stuck at 7 projected seats despite battling for first place in the vote share. The Greens remain stuck at 9-10%, though what we really need to figure out if they can win a second seat is a riding poll in Victoria - none has yet been publicly released.

Friday, October 2, 2015

This Week's Trends: Tories Climbed Further, NDP Fell Further, Grits Still Flat

Very simple story this week: last week's trends continued.


The dotted part of the seat projection graph refers to projections made without taking into account regional breakdowns and riding polls. As explained in this post and as can be seen from the graph, the net effect of including them was very small.

The NDP's drop in Québec is responsible for its losses this week. Up to now, these losses have been relatively slow, but if the NDP drops any further, the losses will come fast and furious. The main beneficiaries so far have been the Tories, who are now projected to win 12 seats in Québec, but the Bloc is approaching the zone where it would gain handsomely from a further NDP collapse.


In terms of the popular vote, the Liberals are still hovering around 29% (30% unadjusted), while the NDP has dropped to almost 26% (27% unadjusted). The NDP's focus at this point is probably to close the gap before Thanksgiving. Otherwise, in the last week, there might be strategic movement toward the Liberals.

Friday, September 25, 2015

Weekly Trends: Tories Gain, NDP Drops, Grits Flat

Given that pollsters seem to be getting faster at reporting (i.e. they now usually release polls 1-2 days after their conclusion rather than up to 3-4 days), I will move my weekly trend posts from Saturday to Friday. Also, given the coming update to the projection model (in order to incorporate information from regional breakdowns and riding polls), this is a good time to look at the trends given by the current model.


In the past 7 days, the Tories have gained 8 seats, while the NDP dropped as many. Much of these changes occurred in Québec. The Liberals were essentially flat, losing one seat, while the Bloc got on the board with one seat.


The popular vote graph shows the same tendencies, although here, one clearly sees the effect of the EKOS poll, with a massive bump for the Tories and a massive drop for the NDP on Sept. 22. However, the down trend for the NDP is unmistakable, even without the EKOS poll: it has dropped 2.6% in the past seven days, and would have dropped 1.9% even if EKOS had not reported. Similarly, Tory gains were also clear: of the five pollsters that have reported in the last two days, only Nanos fails to have the Conservatives at least tied for the lead. As for the Liberals, they have been almost entirely flat since Sept. 7.

Saturday, September 19, 2015

This Week's Trends: Flat, Flat, Flat (at least for seats)

Despite a large number of new polls, the seat trends this week have been remarkably flat: from September 11 to September 18, the ranges were:

CON: 129-131
NDP: 114-116
LIB: 90-93


(You may have noticed that some projections were outside of these ranges. This is because these trends are corrected for the timing of poll releases.)

The Conservative uptick observed late last week and the NDP's gentle decline both appear to have stopped.

However, the picture is somewhat different for the popular vote. There, the NDP's decline has continued, dropping it into second place in the adjusted average. The Liberals were also marginally down, meaning that their momentum from before Labour Day has definitely stalled. However, rather than the Tories, it is mainly the Greens that have benefited from these changes: you can see that all three main parties dropped from 9/14 to 9/15 since there were four polls concluded on 9/15 that were all good for the Greens.


Will next week be as flat? The NDP's statistically significant drop in today's Nanos poll could be an ominous sign for Mulcair (did he lose the debate on the economy?), or it could be the kind of noise that happens 1 time out of 20 even when there's in fact no movement. Stay tuned.

Saturday, September 12, 2015

Introducing *Corrected* Projection Trends

I have finally gotten around to plotting the projection trends for this election. I plan on doing this roughly once a week. Two improvements relative to 2011:
- I will plot vote shares (adjusted for turnout) as well as seat counts.
- The plots will be made by last polling date rather than by the date of the projection. In particular, if a poll with earlier field dates if published after a poll with later ones, the graphs will reflect retroactive calculations.

Here's an example to illustrate the second point above: this week, the Nanos polls conducted 9/5-8, 9/6-9 and 9/8-10 were released on 9/9, 9/10 and 9/11 respectively. Then, later on 9/11, the EKOS poll conducted 9/2-8 was released. The trend graphs reflect not only the updated 9/11 projection (for polling up to 9/10), but also corrected 9/9 and 9/10 projections (for polling up to 9/8 and 9/9, respectively). This retroactive adjustment can be informative: for instance, this week, it helps illustrate that the narrative of Conservatives dropping very low early in the week was exaggerated.


The seat trends this week show a very slow, but steady, NDP decline. The Conservatives followed the NDP trend early in the week, but rebounded late. The Liberals rose in the first part of the week before stabilizing in the last few days. Throughout the week, the Tories were marginally ahead of the NDP for first place; the Liberals have shrunk their gap with the NDP by a third.


The vote trends are similar to the seat trends. Note that with the retroactive calculations due to the EKOS poll, the Tories actually never fell below the Liberals. It's important to once again note here that these vote shares include a turnout adjustment; without it, the Tories would be third currently (and second in the seat count). The good news for the NDP is that despite the turnout adjustment, it has led the pack throughout the week, but its lead has shrunk from 1.9% a week ago (and a high of 2.6% mid-week) to just 0.4% currently.

Perhaps most importantly: variations so far have been so slight that they can all be explained by statistical noise. So it could be that the real trends since September 2 are boring flat lines...

Monday, May 2, 2011

Final Projection: Campaign Trends

Here is the complete trend graph for this campaign. As previously explained, the discontinuity is due to a change in methodology, so the continuous parts of the lines reflect actual variations in the parties' fortunes. Also, as indicated in the main post about the final projection, the numbers plotted as the final point of each line differ from the final projection, which adds a step in the data crunching.

We can see that the Conservatives started the campaign barely in majority territory, but fell out of it due to a strong start by Ignatieff. (Yes, the Grits were actually doing well in the first week. Weird, huh?) For most of the campaign thereafter, they were teetering between a minority and a majority (if you mentally shift the Tory line before the discontinuity up). Throughout the NDP rise, the Conservatives were quite stable, losing just a handful of seats, as I had predicted. This lands them just outside majority territory in the final projection.

The NDP was in the low 30s for the first 60% of the campaign. It was a few points higher in Québec than in 2008, but that wasn't enough for any seat gains. In the rest of Canada, the NDP was actually lower than its 2008 results through the first half of the campaign! As the NDP wave hit Québec, its projected seat count started increasing at a moderate pace until it got to around 50, just 6 days ago. Then it hit the zone where a big chunk of Québec seats swing almost in unison, and the NDP seat count skyrocketed. The rest is history.

It's striking how the Liberal and the Bloc lines are almost parallel, though in the first half of the campaign, the Grits were either on the rise or flat, while the Bloc was already trending downward. While Gilles Duceppe's drop can be at least partly attributed to an uninspired and ill-conceived campaign, Ignatieff didn't do too bad of a job. Unfortunately for him, Jack Layton was much better, and enthusiasm for the NDP crowded out the Liberals.

Friday, April 29, 2011

Updated Trend Graph

Here are the trends updated with today's points.

Two things to note: first, the Liberals have stabilized around the mid-50s. The key number for them is their Ontario vote share, and most recent polls put them at around 28%, except for Ipsos' 21%.

Second, accounting for methodological change (that's the discontinuity on the graph), the Tories are at their lowest point of the campaign. They are still very close to a majority, however, so unless things change drastically in the next two days, there will be a lot of suspense on election night. Don't believe the media saying there's virtually no chance of a Tory majority.

Thursday, April 28, 2011

Updated Trends and Poll Weights

Here is the updated trend graph that I've been promising. The discontinuity in the lines reflects methodological changes. Data in the days before the break has been revised: this is what they would have been without any GTA adjustment (which I have decided to keep at 4%) or change in the vote share formula. This makes it easier to see the parties' true progression.

The other change is that while I used to plot the projection at the end of each day, I have started yesterday to plot the projection at noon as well. So the graph will be a little more choppy from now on.

The story in the past day and a half has of course been the NDP's rise: it gained a whopping 25 seats! However, I don't think it's the main thing to watch going forward - it's fairly likely now that the NDP will finish second, and extremely unlikely that it'll finish first. Indeed, even if the NDP wins the popular vote, it would probably get fewer seats than the Tories, whose vote is very efficient.

Instead, I think that the thing to watch now is the Liberal number in Ontario. The Tories have been flat through the NDP progression because it has made up for losses to the NDP by gains from the Grits in Ontario. However, in the past few days, the Liberal support in Ontario seems to have hit a floor at 28%, which explains the dip in the blue line in the past day. If the Liberals hold on to that 28% of core supporters in Ontario and the NDP numbers from the past two days' polls hold, Harper will be denied a majority. But if the Liberal vote disintegrates in Ontario, the Tories have a good chance of achieving their goal.

Another thing to watch is the Bloc. I'd say they currently have a one-in-three (OK, 1/3 is probably a tad too high) one-in-five chance of losing official party status on Election Day.

Here are the weights on the national polls for the most recent projection. Hopefully this gives you a better sense of how the model works, which can help with understanding the trends:

Nanos 4/24-27: 12%
Nanos 4/20-23: 4%
Nanos 4/17-19: < 1%
EKOS 4/24-26: 19%
EKOS 4/18-20: 3%
Forum 4/26: 20%
Forum 4/20: 5%
Angus Reid 4/25-26: 16%
Innovative 4/21-25: 12%
Environics 4/18-21: 5%
Ipsos 4/18-20: 4%

In bold are the four polls conducted entirely this week. They account for 2/3 of the projection. Polls from last week carry 1/3 of the weight.

Currently, polls with a midpoint date within 2 days of the most recent one (Forum 4/26) are given full weight, which is the square root of the sample size. Polls up to 10 days old are given some weight. As I've indicated a few days ago, I am gradually lowering these thresholds; they were 3 and 12 for most of the campaign, and will be even lower than 2 and 10 for the final projection, which will be almost entirely based on this week's surveys. There is also additional depreciation for polls that are not a firm's most recent one.

Tuesday, April 26, 2011

Updated Trends and Riding Polls

Just five days left in the campaign! The updated trend graph of course shows a steep NDP climb, along with heavy Liberal and Bloc drops. The Conservatives' uptick has been modest, and half of it (3 seats) was caused by the phasing in of a change to the model.

I predicted the flatness of the Conservative seat count in the event of an NDP rise. However, if the Liberals collapse in Ontario, Harper would get a safe majority unless the NDP gets as high in Ontario as it is in Québec - the latter still appears very unlikely.

Two riding polls to report: one by Léger in Lac-Saint-Louis, where Conservative star candidate Larry Smith trails the Liberal incumbent by just 6%, down from 20% in an earlier CROP poll. This Léger poll appears to be dated (the linked writeup only says it was conducted after the debates).

The other poll, conducted 4/18-19, shows Elizabeth May 7% ahead of Gary Lunn in Saanich--Gulf Islands, with the NDP and Liberals both under 10%. Now, this is a poll commissioned by the Green Party and I'm not familiar with this pollster (Oracle). The Conservative support level, 38%, is right around what you'd expect, but one has to be skeptical that May has indeed pushed the NDP and Liberals under 10%. For all these reasons, I will not allow this poll to tip the projection unless there is independent confirmation.

Saturday, April 23, 2011

Trends 3/4 Through the Campaign

As I have done at the 1/4 and the 1/2 marks of the campaign, I now bring you the trends in my daily projections.

As you can see, the Conservatives have been essentially flat since the first week, just a few seats shy of a majority. The Liberals are down slightly: it's a loss of only two seats since the leaders' debates. However, the more precious loss by the Grits is momentum: they are now at risk of dropping precipitously if the NDP makes gains in Ontario.

The most salient features of the third quarter of the campaign are of course the Bloc's decline and the NDP's rise. The former was already apparent in the first half of the campaign, but accelerated in the past few days. The latter only came about this week. The NDP has yet to overtake the Bloc in third place, but unless their recent surge abruptly reverses, it will happen very soon.

The Conservative advantage over the Liberals has been essentially flat around 11% since April 5. The current uptick is almost exclusively due to the Ipsos poll showing a 22% difference.

Wednesday, April 13, 2011

Trends Halfway Through the Campaign

The halfway point of the campaign will occur tonight, at the start of the French debate (if you count from Harper's visit to the GG to the first polls opening in Newfoundland). It's a pretty natural point to take a look at the trends so far, especially given that tomorrow's polling will start containing debate effects.

Picking up where we left after the first quarter of the campaign, the Conservative slide has stopped (but not reversed). However, the Liberals kept rising due to the Bloc's weakening. The NDP, for all the excited talk about it ("It's way up in Québec!" "It's dropping off the map in Ontario!"), has been as flat as Saskatchewan.

The Liberal gains, however, are fragile. If Nanos' latest release is right about the Bloc picking back up in Québec, Ignatieff would be back where he was 10 days ago, below Dion's results.

The national gap between the Tories and Grits has been essentially unchanged at 11% for the past week until the bump today, which is entirely due to the crazy-looking COMPAS poll.

Finally, a note: I've actually been in Asia for the past few weeks, and I'll be traveling back to North America tomorrow. Therefore, there won't be an update tomorrow morning, though I should be able to post tomorrow night, after I get home.